Facebook Ads Benchmarks for B2B SaaS: CTR, CPC, CPL

June 15, 2026
Imagine you’ve launched a Facebook Ads campaign to promote your B2B SaaS product. Naturally, you’re curious to see how it’s performing. When you check the stats, you see that the CTR is 0.7% and the CPL is $95. Is that good or bad? The short answer: it depends on what you sell, who you target, and what you count as a qualified lead.
But there’s good news! There are industry-specific Facebook Ads benchmarks you can rely on, so you don’t have to set up your campaign through trial and error. In this article, we’ll explain how to use these benchmarks to evaluate your campaigns, what it means to deviate from the range, where to look for the cause of poor performance, and when a Facebook campaign makes sense for B2B SaaS.
Why Facebook Still Belongs in the B2B SaaS Media Mix
Facebook is rarely the default acquisition channel for SaaS. LinkedIn usually provides more precise B2B targeting. But Facebook still has a place in the media mix, and it’s not just about reach. According to HubSpot’s 2026 marketing statistics, 43% of marketers rank Facebook as one of the social media platforms that delivers the highest ROI.
Across SaaS paid ads benchmarks, Facebook often has a meaningful cost advantage for SaaS teams: cheaper access to the audience. Facebook CPC for SaaS typically sits around $1.50–$3.50, depending on the audience and campaign objective. LinkedIn benchmarks are materially higher, with average CPC often ranging from $4.50–$12, and competitive B2B audiences such as C-suite, tech, and finance reaching $10–$15+.
This means Facebook can deliver more traffic for the same budget. The question is how much of that traffic can be turned into qualified pipeline. Facebook does not fully replace LinkedIn, but it can work in specific scenarios.
One scenario is Facebook retargeting ads for warm audiences, such as website visitors, trial users, trial non-activators, and CRM contacts. Because these users have already interacted with the brand or product, Facebook can bring them back more cost-effectively than LinkedIn can.
The second scenario is TOFU awareness for products with a broad total addressable market (TAM). This is particularly relevant for product-led growth (PLG), self-serve, and small-to-medium-business (SMB) SaaS, where the path to first action is shorter and the audience isn’t limited to a few narrow job titles.
For enterprise SaaS with a narrow ICP, the logic changes. LinkedIn is better for targeting precision because job title, seniority, company, industry, and account-level filters are more reliable there. In this case, Facebook is better suited as a supplementary awareness or retargeting channel rather than the primary prospecting engine.
Facebook Ads Benchmarks for B2B SaaS: CTR, CPC, CPL, and CVR
Most B2B SaaS competitors will not publish their campaign data. Benchmarks are usually the closest external point of reference. However, most Facebook Ads benchmark reports show average figures across all industries. These numbers are useful as a general guide, but they should not be treated as direct targets. Technology and SaaS campaigns differ from retail, real estate, and local services in terms of sales cycle, lead cost, and conversion quality. We compiled recent benchmark data from several reports. The B2B Facebook Ads benchmarks below should be used as a diagnostic framework, not universal targets. They help you identify potential issues in the audience, offer, creative, or post-click experience.
Facebook Ads Benchmarks for B2B SaaS (2025–2026)
CTR
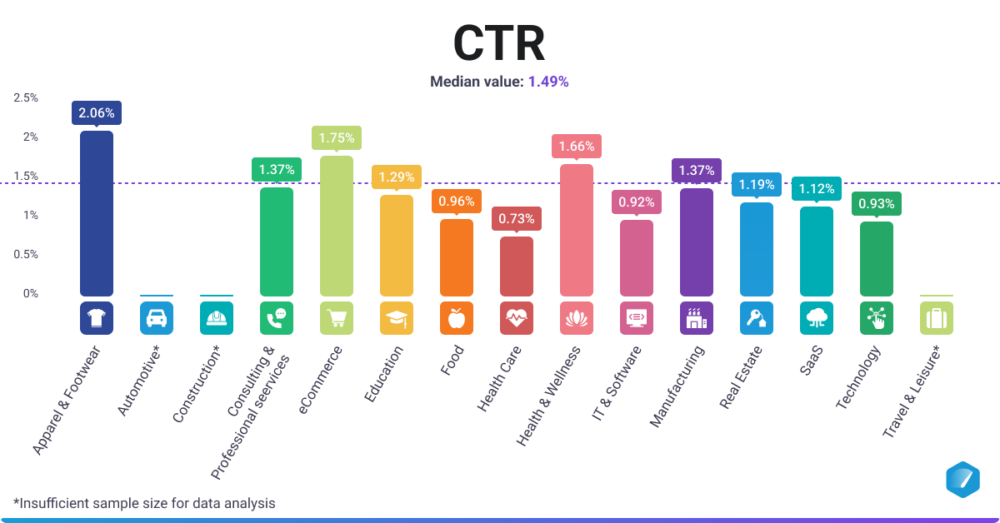
Facebook CTR depends heavily on audience, offer, and campaign objective, so the all-industry median should not be used as a direct B2B SaaS benchmark. According to Databox, the overall median is 1.49%, while the figure for SaaS specifically is 1.12%. Related categories are lower: Technology – 0.93%, IT & Software – 0.92%.
For B2B SaaS prospecting campaigns, a practical Facebook Ads CTR benchmark remains approximately 0.60–1.00%, depending on the ICP, creative, and audience size. Retargeting typically delivers a higher CTR, around 1.2–1.8%, because the audience is already familiar with the product or brand.
CPC
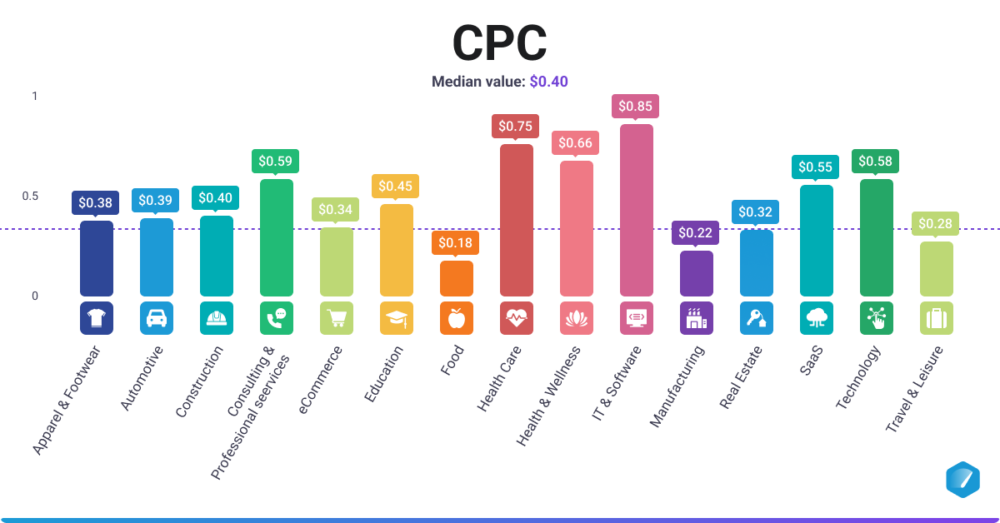
Facebook CPC remains one of the platform’s key cost advantages for B2B SaaS. According to Databox, the median CPC is $0.55 for SaaS, $0.58 for technology, and $0.85 for IT and software. In comparison, the median CPC is $0.59 for consulting and professional services, $0.75 for health care, and $0.45 for education. These figures show that SaaS and technology are close to other professional and knowledge-based categories, while IT and software are significantly more expensive.
For practical planning, a single Facebook Ads CPC benchmark is not enough. CPC may be higher in retargeting, narrow B2B audiences, and conversion campaigns.
CPL
CPL is harder to compare because sources define conversions differently: form submissions, raw leads, MQLs, SQLs, demo requests, or trial sign-ups. Therefore, raw lead cost and qualified lead cost cannot be evaluated on the same scale.
According to WordStream, the average cost per lead for Facebook Lead Ads across all industries is $27.66. Databox provides a more accurate industry proxy via cost per conversion: $34.49 for SaaS and $34.19 for IT & Software, compared to an overall median of $22.54 across all industries. These figures are useful as a baseline, but not as a Facebook Ads CPL benchmark for qualified SaaS pipeline.
Our experience shows that for B2B SaaS, Facebook ads prices are higher:
- Raw lead: approximately $34–65
- Standard B2B SaaS lead: $40–65 CPL
- Qualified lead: typically $150+
- Cost per SQL / opportunity must be calculated separately in the CRM, because Facebook Ads Manager does not show this
For Facebook Ads cost SaaS analysis, Facebook may look efficient at the first-action level, but quality only becomes apparent further down the funnel. For SaaS, you need to look not only at CPL, but also at MQL rate, SQL rate, and cost per opportunity.
CVR
The conversion rate after a click depends on where the conversion takes place: in a Meta Instant Form or on an external landing page. According to WordStream data for 2025, the average conversion rate for Facebook lead campaigns across all industries is 7.72%. This is a general benchmark for lead generation campaigns on Meta.
Instant Forms typically yield a higher CVR because the user doesn’t leave Facebook or Instagram, and some data is filled in automatically. Landing pages often have lower conversion rates but offer more control over messaging, qualification, and downstream tracking.
It is incorrect to compare Instant Forms and landing pages based solely on CVR. An Instant Form may generate more submissions but underperform on MQL or SQL rates. For B2B SaaS, CVR should be only the first layer of Meta Ads performance metrics. The next layer is how many of these conversions become MQLs, SQLs, opportunities, and pipeline.
What Moves Facebook Ads Benchmarks: Audience, Offer, and Automation
Benchmark ranges do not explain performance on their own. For example, two campaigns may have the same CPL, but they may have completely different lead quality because the numbers represent different audiences, offers, creatives, and levels of automation. To interpret the data correctly, first identify what is influencing CTR, CPC, and CPL.
Audience
Audience often has the strongest impact on results. The difference between cold prospecting and retargeting can transform the economics of a campaign.
In our experience with B2B SaaS clients, Facebook retargeting can reduce cost per qualified lead by 40–60% compared to cold campaigns.
Another useful example from Aimers’ own Facebook Ads examples comes from Propello, a B2B SaaS loyalty management platform. In this campaign, we combined Facebook retargeting with hyper-targeted prospecting. This approach increased sign-ups by 235% and reduced Meta CPA by 33%.

Another example comes from our work with Upper Hand, a SaaS platform for sports business management. We ran systematic A/B tests across creative and audience segments, including lookalike audiences based on high-value leads. This reduced the cost per MQL on Facebook and Google Ads by over 50% and increased conversions by 345%.
Offer
The offer determines who clicks and how strong their intent is. Educational offers such as guides, reports, and webinars typically generate higher CTR and CVR because they require less commitment. But a higher conversion rate doesn’t always mean a better pipeline.
Demo requests or trial sign-ups attract fewer people, but the intent signal is usually stronger. The user is not just consuming content; they are ready to take the next step toward the product. SaaS companies should compare offers not only by CPL, but also by MQL-to-SQL rate, demo booked rate, and cost per opportunity.
In our experience working with various SaaS clients, BOFU offers to a warm audience often yield a higher-quality pipeline than TOFU content targeting cold traffic.
Creative
Creative affects not only CTR but also click quality. In B2B SaaS, creative needs to do more than stop the scroll; it must immediately set the right context: who the product is for, what problem it solves, and what the next step is.
If the CTR is low, the problem may lie in an ineffective hook, visuals that do not match the audience, or a message that does not set the right intent. On the other hand, if the CTR is high but the SQL rate is low, the creative may spark curiosity without driving purchase intent. Creative testing should be evaluated by both click metrics and downstream quality.
Automation
Meta Advantage+ campaigns can lower CPA by automatically expanding the audience, automating creative testing, and optimizing delivery. According to Meta’s data, Advantage+ Shopping campaigns have a 17% lower CPA and a 32% higher ROAS than manual campaigns. These figures cannot be directly applied to B2B SaaS because the benchmark comes from shopping campaigns, but they illustrate the general logic behind Advantage+: more automation, broader signals for the algorithm, and lower costs per result when sufficient data is available.
One of the more practical Meta Ads best practices is to match automation to the business model. If a product has a broad TAM, PLG strategy, or self-serve model, automation can effectively identify additional conversion opportunities. However, for enterprise SaaS with a narrow ICP, Advantage+ may expand the audience to include irrelevant roles and companies. As a result, CPL may look favorable while SQL rate decreases.
How to Use Benchmarks to Diagnose Campaign Performance
Once the key variables are understood, Facebook Ads performance benchmarks can be used as a diagnostic tool. A paid social ads agency should not start with CPL alone. Instead, move from cause to effect. First, check audience and delivery. Then, check CTR and frequency. Next, check post-click conversion. Only then should you compare CPL with the range typical for your type of offer.
For B2B SaaS Facebook campaigns, the diagnostic order should look like this.
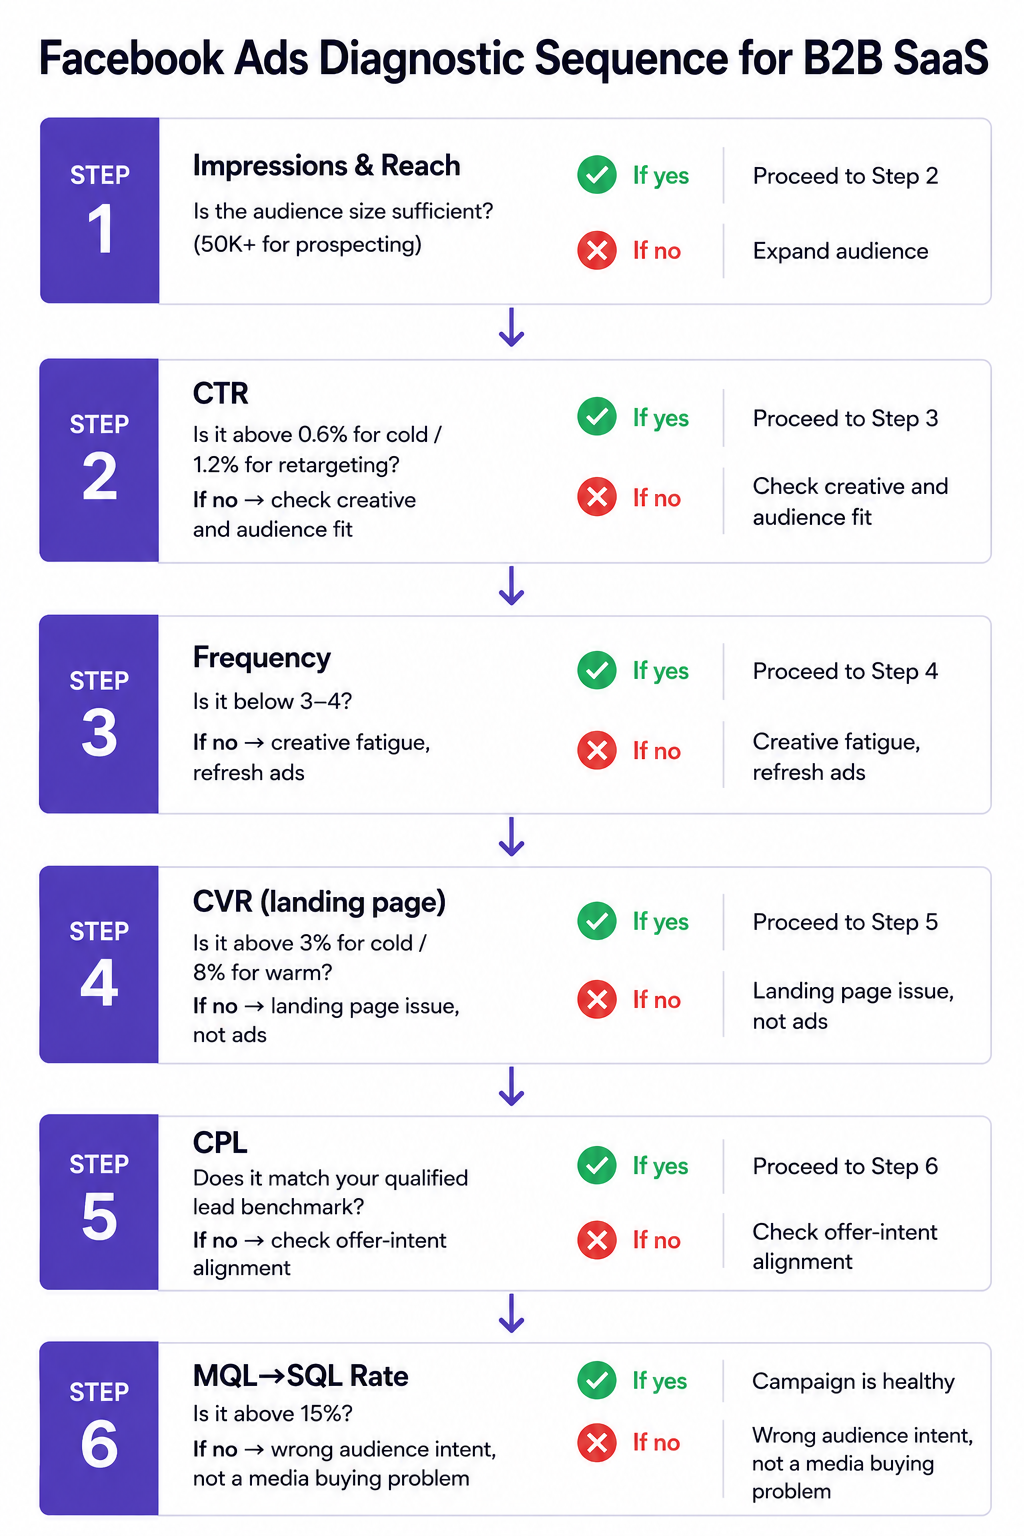
Here is how to read each signal.
First, check audience size and reach. Determine whether the audience is large enough. For prospecting campaigns, the practical minimum is usually around 50,000 members. If the audience is smaller than that, it becomes more difficult for the algorithm to identify consistent patterns, frequency increases more rapidly, and results become less predictable.
CTR. If the CTR is below 0.5%, it's an early warning sign of a problem. First, check the frequency. If it’s above 3–4, the audience may be oversaturated with impressions, and the ad is starting to lose its effectiveness. If frequency is normal, examine how well the creative aligns with the audience and the offer’s funnel stage.
Frequency. In narrow B2B SaaS audiences, frequency increases more quickly than in broad B2C campaigns. When frequency rises above 3–4 and CTR starts to drop, the problem is usually not the budget. More often, this is a signal to update the creative, expand the audience, or change the approach. This is a practical threshold, not a SaaS-specific benchmark from independent research.
CVR. If the CTR is normal but the CPL remains high, the problem is often after the click. Check the landing page, Instant Form, offer, and number of fields. At this point, it’s usually too early to change the creative or budget because the ad is already doing its job.
CPL. Only then does it make sense to compare CPL to the benchmark. Compare it not to the Facebook average, but rather to the range for your specific offer type, whether it is a raw lead, free trial, demo request, or qualified lead.
MQL-to-SQL rate. If Facebook leads are not converting well to SQL, the problem may not be media buying, but audience intent. For example, the offer may attract an audience ready to download materials but not ready to speak with sales. A 15% threshold can be used as a practical quality control guideline, but not as a universal SaaS benchmark.
The Learning Phase should be evaluated separately. According to Meta, an ad set typically requires about 50 optimization events over seven days to exit the Learning Phase and stabilize delivery. If a campaign is in “Learning Limited” status, it becomes more difficult to compare it to benchmark values because the algorithm has not yet accumulated enough data for stable optimization.
For B2B SaaS, this quickly becomes a budget constraint. For instance, with a CPL of $100, a single ad set would need to spend approximately $5,000 over seven days to accumulate 50 conversion events and exit the Learning Phase. If that same budget is spread across multiple ad sets, however, each one may receive too few events and remain in “Learning Limited” status. In this state, results will fluctuate, and comparisons with benchmark values will become less reliable.
This is why small SaaS accounts often need a more streamlined structure, not more campaigns. The solution usually involves consolidating ad sets, reducing the number of parallel tests, and selecting a conversion event that provides the algorithm with sufficient data.
Benchmark Summary and Decision Framework
To sum up, it’s important to note that the effectiveness of Facebook (as with any other PPC platform) for B2B SaaS depends heavily on the use case. The same SaaS Facebook Ads benchmarks for CTR, CPC, or CPL can lead to vastly different results for the sales pipeline depending on the audience, the offer, and the stage of the funnel. To make the benchmarks actionable, let’s break down Facebook Ads into three use cases: retargeting, PLG and SMB acquisition, and enterprise prospecting. Each has its own economics and its own success metrics.
Scenario 1: Retargeting
Retargeting is the most predictable and often the most effective use case for B2B SaaS on Facebook.
Audiences are usually created based on website visitors, CRM lists, and engagement audiences. Common offers include demo requests, consultations, case studies, and product-specific pages.
CPL is often 40–60% lower than in cold traffic campaigns, and the SQL rate is
significantly higher due to existing interest in the product. Due to lower CPC, Facebook is often more cost-effective than LinkedIn for warm audiences.
Key metrics to track:
- CPL
- MQL rate
- Cost per SQL
Scenario 2: PLG and SMB Acquisition
For teams trying to generate leads on Facebook, the channel is often most useful as a top-of-funnel acquisition channel for PLG and self-serve SaaS products.
A typical structure includes broad audiences, lookalike audiences based on existing customers, and interest targeting. The most common offers are:
- Free trials
- Product demos
- Freemium plans
In this scenario, Facebook can win on scale and cost per click (CPC). CPC typically ranges from $1.20 to $2.50. Lead volume is higher than on LinkedIn, but the quality of leads and the SQL rate are generally lower than with retargeting.
Key metrics:
- CPC
- Cost per trial start
- Trial-to-paid conversion rate.
Scenario 3: Enterprise Prospecting
This is the most challenging scenario for Facebook. A narrow ICP, small audiences, and limited B2B targeting capabilities result in higher frequency and less stable CTR for cold traffic. In most cases, LinkedIn provides more precise access to decision-makers through job title, seniority, and company targeting.
Here, Facebook is more often used as a supplementary awareness or retargeting channel for audiences that have already been reached through LinkedIn or other demand generation activities.
Red Flags That Signal Structural Problems
Regardless of the scenario you choose, several indicators usually point to a structural problem:
- The campaign has been in “Learning Limited” status for more than 7 days
- The frequency exceeds 4 without updating creatives
- CPL is below $30 for a B2B SaaS offer, and there is no lead quality control
- Reporting is limited to CTR or CPL without CRM data
- BOFU offers are launched to a completely cold audience
- There are no exclusion lists
Follow the Right Optimization Order
For Facebook Ads campaign optimization, follow the correct sequence.
When to Use Facebook Ads for B2B SaaS: Three Scenarios
First, evaluate audience quality: segment size, retargeting versus prospecting, exclusions, and data quality. Next, check the offer for alignment with the funnel stage. Then, analyze creative. Finally, examine the landing page or form. A Facebook Ads agency should catch that before creative testing begins: creative optimization rarely solves the problem if the audience or offer strategy was wrong from the start.
Turn Facebook Ads Benchmarks Into Pipeline Decisions
Benchmarks are useful only when they help explain what is happening inside the campaign: whether the audience is too narrow, the offer is too cold, creative is attracting the wrong clicks, or CPL is hiding weak SQL quality. For B2B SaaS, the real question is not whether Facebook looks cheaper than LinkedIn. The question is whether lower CPC and CPL can still produce qualified pipeline.
As a SaaS digital marketing agency focused on B2B SaaS, we help teams evaluate Facebook Ads beyond CTR, CPC, and CPL. We connect benchmark ranges to CRM data, SQL rate, cost per opportunity, and funnel stage, then identify where the account needs better targeting, a stronger offer, cleaner retargeting, or a different campaign structure.
FAQs
What Is a Good Facebook Ads CTR for B2B SaaS?
What Is a Good Facebook Ads CPC for B2B SaaS?
What Is a Good Facebook Ads CPL for B2B SaaS?
Are Facebook Ads Effective for B2B SaaS?
How Should B2B SaaS Teams Use Facebook Ads Benchmarks?

February 24, 2025