
SaaS Conversion Rate Benchmarks by Funnel Stage

.avif)
There is no single "good" SaaS conversion rate. The same number can mean very different things depending on where it appears in the funnel and how the business acquires and converts customers.
A 3.8% SaaS landing page conversion rate sits around Unbounce's median. An 8% free-to-paid rate matches the median in ChartMogul and ProductLed's 2026 dataset. And MQL-to-SQL conversion ranges from 26% to 51% by channel in First Page Sage's B2B SaaS data. None of those numbers is useful in isolation. A benchmark only becomes meaningful when the funnel stage, GTM motion, traffic source, ACV, and conversion definition match your own data.
In our work, we use benchmarks as diagnostic reference points. The goal is not to hit the highest number in a report. It is to identify where qualified demand is dropping out, understand what is driving the gap, and decide which part of the funnel deserves attention first.
In Brief: What the Benchmarks Tell Us
- Benchmark each funnel stage separately. Visitor-to-lead, landing page conversion, activation, trial-to-paid, MQL-to-SQL, SQL-to-opportunity, and close rate measure different parts of the customer journey
- Match the benchmark to the SaaS motion. PLG and self-serve teams should prioritize activation and trial-to-paid, while sales-led teams need to look more closely at demo quality, MQL-to-SQL, SQL-to-opportunity, and win rate
- Normalize for traffic source and conversion definition before comparing. Branded search, non-brand search, cold paid social, retargeting, and organic content should not share one conversion target
- Work backward from pipeline. A higher conversion rate is only a win if downstream quality holds. More signups, form fills, or MQLs do not help if SQL quality, opportunity creation, CAC, or ARR gets worse
- Use external benchmarks as reference points, then validate them against your own data. Check the peer group, ACV, sample size, time window, funnel definition, and your historical baseline before changing campaigns, landing pages, qualification, or sales processes
Methodology and Source Notes
We use benchmarks as diagnostic reference points, not performance targets. A conversion rate only becomes useful when we compare like with like: the same funnel stage, GTM motion, traffic source, and conversion definition.
That distinction matters because the datasets in this guide measure different parts of the funnel. A landing page form submit, a qualified lead, a free-to-paid conversion, and a sales opportunity are not interchangeable. Before we compare a client's performance with an external benchmark, we first check what the source actually counts as a conversion and how closely its sample matches the business we are analyzing.
Landing Page Benchmarks
For landing page performance, we use Unbounce's Conversion Benchmark Report. Its benchmark dataset covers more than 41,000 landing pages, 464 million unique visitors, and 57 million conversions collected between July 2023 and July 2024. We use these figures primarily for landing page and traffic-source comparisons rather than broader funnel-stage benchmarks.
Industry and Channel Benchmarks
Ruler Analytics gives us a broader view of conversion performance by industry and acquisition source. Its 2026 dataset includes more than 110 million sessions and 5 million conversions across 13 industries. Importantly, Ruler defines a conversion as a qualified lead or sale, including offline outcomes, so we do not compare its rates directly with landing page form-submit benchmarks.
Free-Trial and PLG Benchmarks
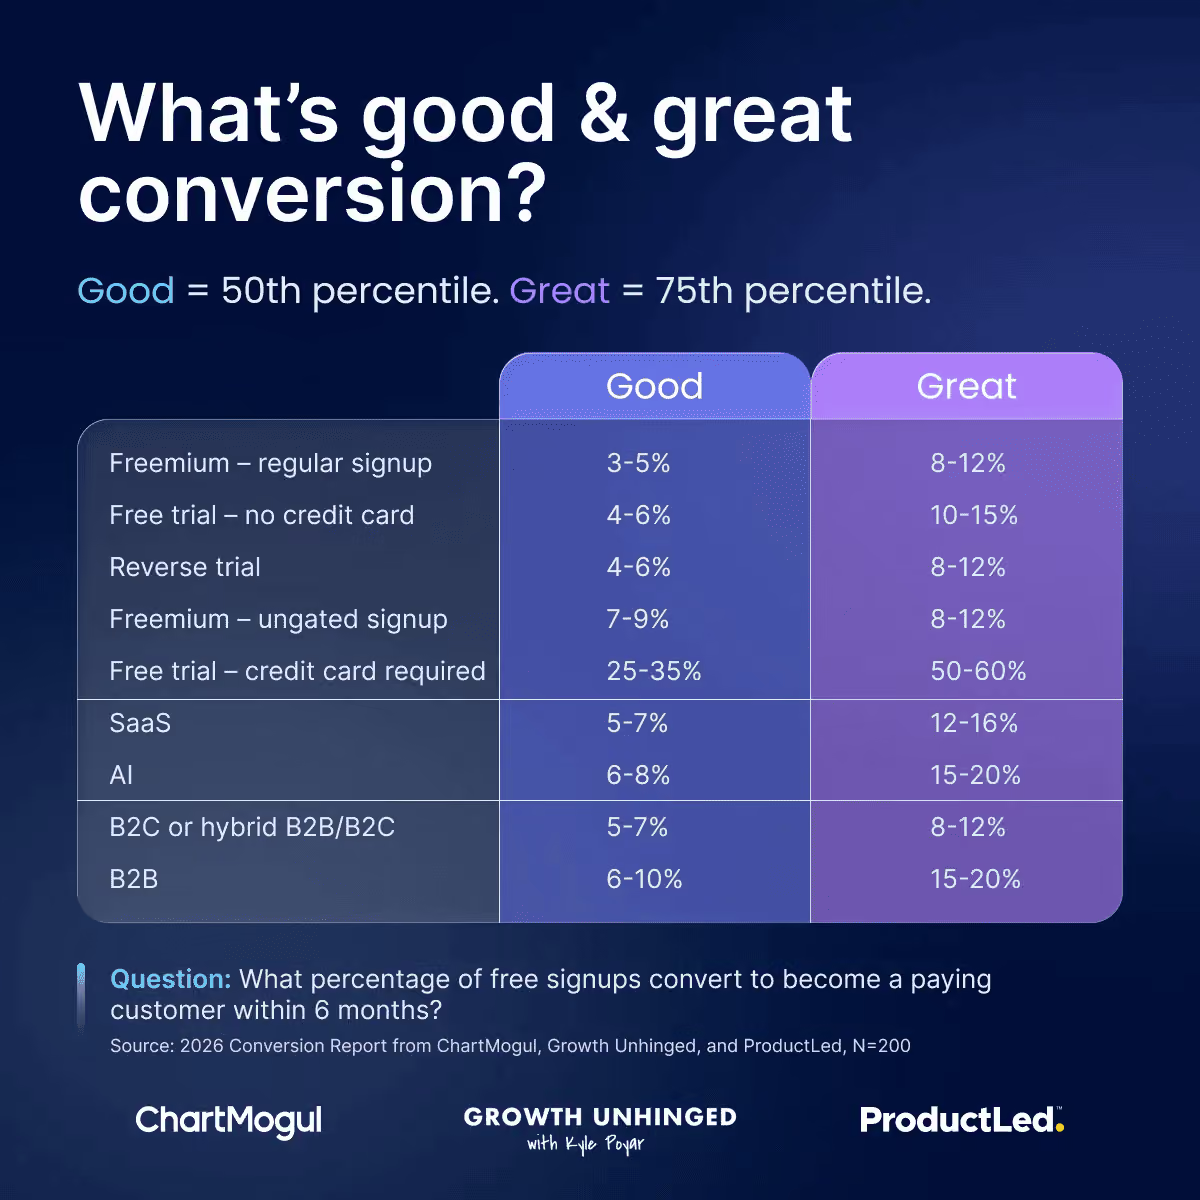
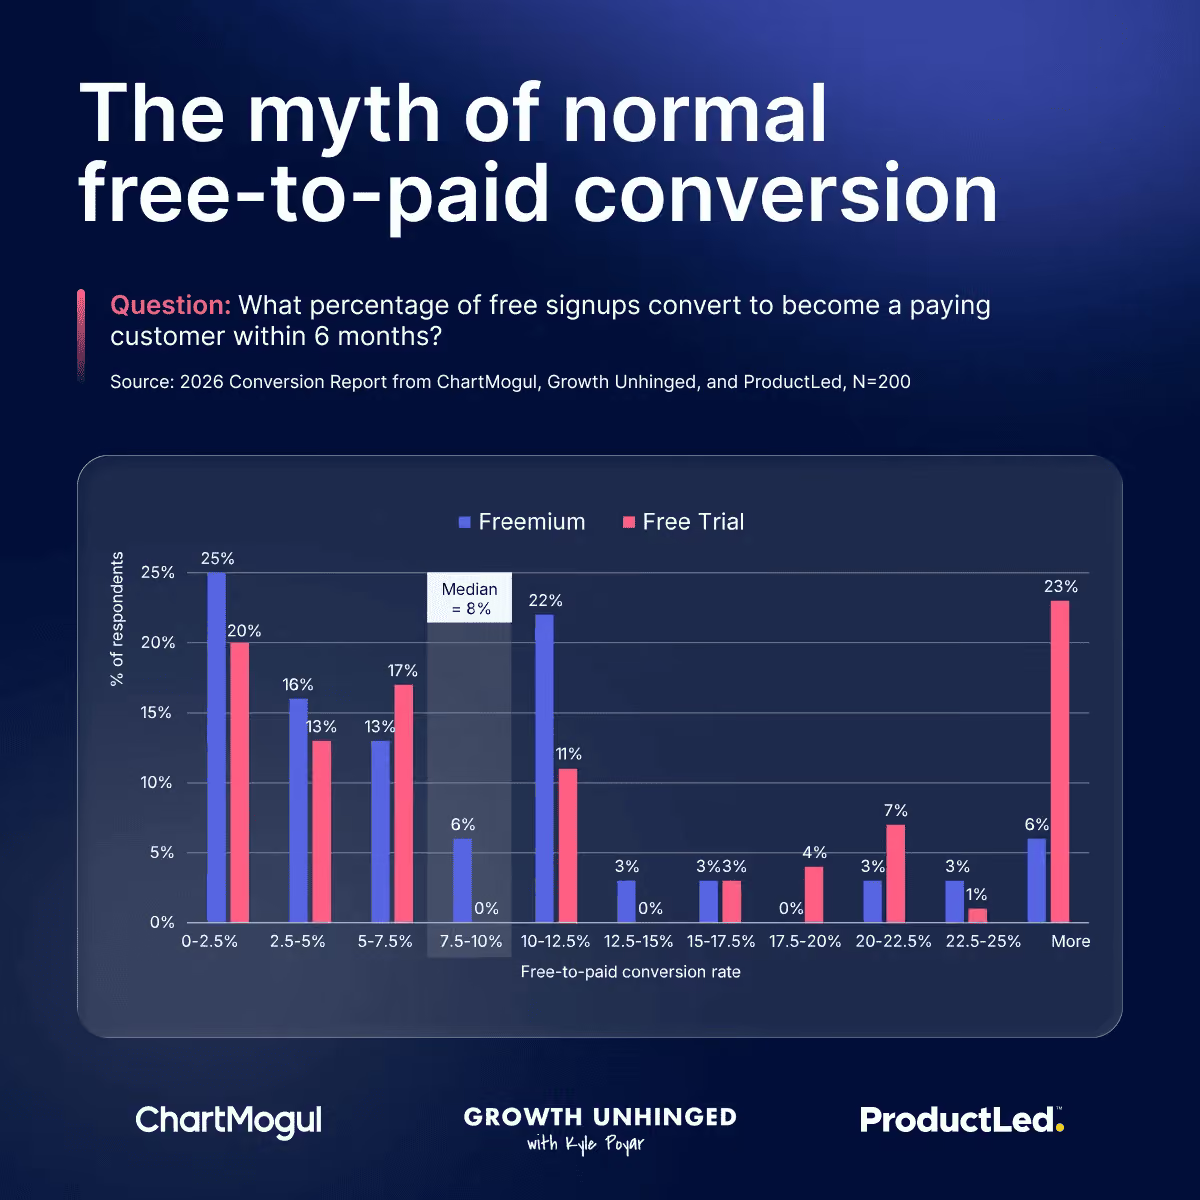
For product-led funnels, we use ChartMogul and ProductLed's 2026 SaaS Conversion Report. The study covers 200 B2B software products and tracks how free trials and freemium users move into paid plans. Its 8% median free-to-paid conversion rate is useful as a reference point, but the wide performance spread is more important than the median itself. Product model, trial setup, activation, and time-to-value can shift the result substantially.
Sales-Led SaaS Funnel Benchmarks
For lead-to-MQL, MQL-to-SQL, SQL-to-opportunity, and later sales stages, we reference First Page Sage's B2B SaaS funnel data. Its benchmarks are based on more than 50 B2B SaaS clients, primarily companies in the $10M-$100M revenue range. We therefore use these numbers mainly as directional comparisons for sales-led B2B SaaS, not as universal SaaS averages.
Measurement Definitions
We also use Google Analytics documentation to keep measurement terminology consistent. GA4 separates standard events from key events that represent important business actions, while conversions are used for campaign measurement and advertising workflows. In practice, benchmark comparisons become unreliable when analytics events and CRM lifecycle stages describe different outcomes.
Together, these sources give us an external baseline for SaaS conversion rate benchmarks. The next step is diagnosis: matching that baseline to the company's own funnel, source mix, GTM motion, and downstream pipeline quality.
2026 SaaS Conversion Benchmark Ranges
When we audit a SaaS funnel, we use benchmarks to identify where the biggest leak may be, not to grade the account against a universal "good" conversion rate. Start with the closest funnel stage below, then narrow the comparison by GTM motion, traffic source, ACV, and conversion definition.
The figures below use the latest public datasets available for this guide. Not every underlying dataset was collected in 2026, so we treat these numbers as directional reference points rather than fixed 2026 targets.
For landing pages, Unbounce reports a 3.8% median SaaS conversion rate, but source alone creates a large spread: Google search traffic converts at 5.1%, Bing at 1.9%, and display traffic at just 0.3%. That is why we would not benchmark a cold display or paid social landing page against a high-intent search page.
For sales-led funnel stages, a B2B SaaS Conversion Rate Benchmarks Report is most useful when it preserves channel-level differences instead of collapsing them into one average. First Page Sage's data shows why: visitor-to-lead ranges from 0.7% for PPC to 2.2% for LinkedIn, while MQL-to-SQL ranges from 26% for PPC to 51% for SEO. We do not read those differences as "one channel is better." We look at what each source contributes further down the funnel before changing budget or targeting.
For PLG, the ChartMogul and ProductLed dataset makes the limitation of a single benchmark even clearer. The median free-to-paid conversion rate across 200 B2B software products is 8%, but there is roughly a 10x gap between the top and bottom 20% of self-serve products. Trial mechanics matter too: a free trial without a credit card has materially different conversion economics from one that requires payment details upfront.
One number we would not drop directly into this table is Ruler Analytics' 7.6% average conversion rate for software. Ruler defines a conversion as a qualified lead or sale and includes both online and offline outcomes. We use that dataset for broader industry and source-level context, not as a substitute for visitor-to-lead or landing-page CVR.
Why SaaS Conversion Benchmarks Are Hard to Interpret
SaaS benchmarks are easy to quote and easy to misuse. A number only becomes useful when the funnel stage, conversion definition, traffic source, and GTM context match what we are actually measuring. In our work, most benchmark mistakes start when teams compare rates that look similar but represent different buyer behavior.
One Benchmark Is Not Enough
The biggest mistake in benchmark analysis is comparing metrics that describe different jobs in the funnel. Website visitor-to-lead, landing page conversion, demo completion, activation, trial-to-paid, MQL-to-SQL, SQL-to-opportunity, and opportunity-to-close may all be called "conversion rates," but they measure different behavior.
A 3.8% landing page conversion rate and a 40% MQL-to-SQL rate can both be healthy. The first tells us how effectively a page turns traffic into an action. The second tells us how well marketing-generated demand survives qualification and sales acceptance. Comparing them without funnel context does not tell us where performance is actually strong or weak.
When we benchmark a SaaS funnel, we first map each metric to a clear denominator, conversion event, and lifecycle stage. Then we compare it with a peer range that reflects a similar GTM motion, traffic source, and ACV. That usually gives us a much more useful question than "Is our conversion rate good?": Where is qualified demand dropping out of the funnel?
Definitions Change the Number
The conversion definition is part of the benchmark, not a footnote.
A "demo conversion" might mean a completed form, a qualified request, an attended meeting, or an accepted sales opportunity. A "trial conversion" might refer to signup, activation, payment, or a retained paid account. Even MQL can represent very different thresholds depending on whether the company prioritizes firmographic fit, behavioral intent, lead score, or a direct hand-raise.
That distinction matters in measurement too. In the current GA4 model, an interaction is tracked as an event, important business actions can be marked as key events, and actions used for campaign measurement and optimization can become conversions. The analytics setup still has to reflect the company's actual lifecycle definitions. A generate_lead event does not tell us whether that lead became an MQL, SQL, or opportunity unless those stages are connected downstream.
.avif)
When we run a CRO audit, we align analytics events with CRM stages before drawing conclusions from a benchmark. Otherwise, a campaign can appear to "convert" well while the pipeline tells a different story.
Traffic Source Changes the Benchmark
Traffic source can move conversion rates dramatically even before we account for ICP or sales motion. Unbounce reports a 5.1% median conversion rate for SaaS traffic from Google search ads versus just 0.3% for display traffic. That is roughly a 17x difference inside the same industry, driven largely by the context and intent behind the visit.
That is why we do not benchmark all website traffic, or even all paid traffic, against one conversion target.
We apply the same separation when analyzing paid acquisition. Brand, non-brand, competitor, Performance Max, LinkedIn, and other paid channels have different jobs in the funnel, so we look at their pipeline contribution and economics separately rather than forcing them into one blended CPL or CVR.
Benchmarks by Funnel Stage
Once the benchmark is matched to the right source, definition, and GTM motion, we move through the funnel stage by stage. The goal is not to make every conversion rate look higher. It is to find where qualified demand is dropping out and what is most likely causing the leak.
Website Visitor to Lead
The visitor to lead conversion rate is one of the broadest funnel metrics and one of the easiest to misread. We segment it by source, page type, brand vs. non-brand traffic, device, new vs. returning visitors, and offer before drawing conclusions.
If sitewide conversion is weak, traffic quality is the first thing to check. TOFU content, cold paid social, and high-intent comparison pages serve different jobs and should not be held to the same conversion target.
Landing Page Conversion Rate
Landing pages are easier to benchmark than an entire website because they usually connect one audience, traffic source, message, and offer.
When relevant paid traffic reaches a page but conversion stays weak, we look first at message match, offer clarity, proof, friction, and the next step. Sending more traffic into the same post-click experience usually scales the problem rather than solving it.
Demo Request Conversion
For sales-led SaaS, we break demo conversion into smaller steps: demo page visits, form starts, completed requests, qualified requests, attended demos, SQLs, and opportunities. This separates form performance from actual sales value.
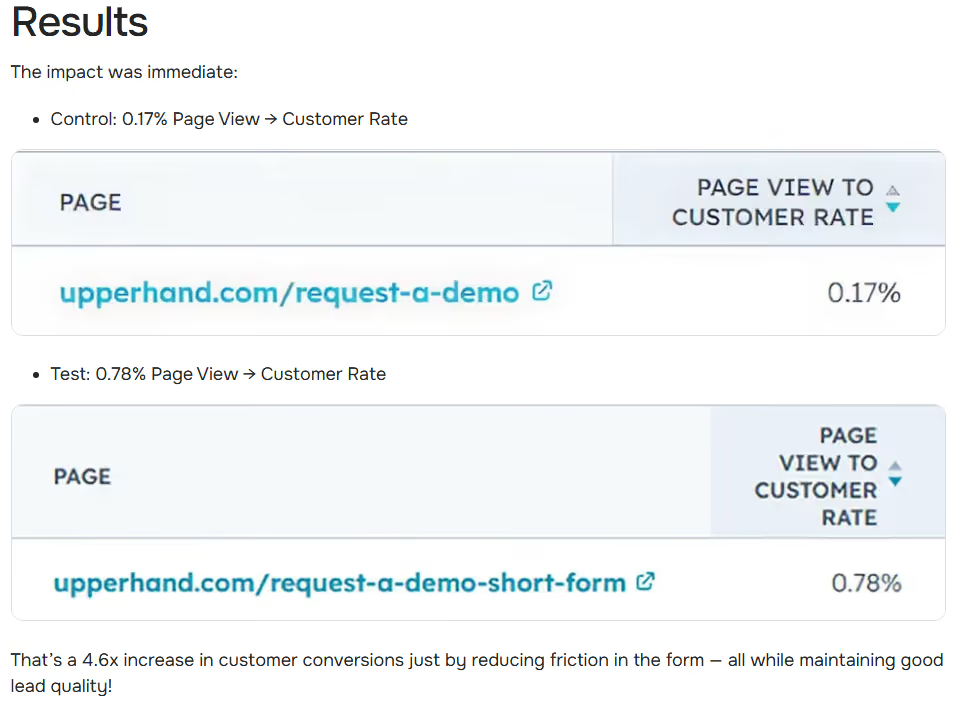
More friction is not automatically bad, especially for enterprise products where qualification protects sales capacity. But friction needs to qualify the buyer, not simply make the path longer. In our work with Upper Hand, simplifying a multi-step demo flow into a single form increased the Page View to Customer rate from 0.17% to 0.78%, a 4.6x lift, while maintaining lead quality.
Trial Signup, Activation, and Trial to Paid
For PLG and self-serve SaaS, trial-to-paid should sit next to the activation milestones that predict payment: completing setup, connecting data, inviting teammates, using a core feature, or reaching the first value moment.
ChartMogul and ProductLed found an 8% median free-to-paid conversion rate across 200 software products, but there was a 10x gap between the top and bottom 20% of self-serve products. That spread is more useful than the median alone because product setup, signup friction, activation, and time-to-value can materially change the result. For more context on current SaaS CRO trends, see our broader analysis of how conversion strategy is changing.
Lead to MQL
Lead-to-MQL shows whether acquisition is bringing in people who match the company's qualification rules. The metric only works if those rules are stable and tied to real ICP fit.
If lead-to-MQL is high but MQL-to-SQL is weak, scoring may be too loose. If lead-to-MQL is low, we look at traffic quality, offer fit, and whether qualification criteria are filtering too aggressively.
MQL to SQL
MQL-to-SQL is where acquisition quality meets sales acceptance. A weak rate usually sends us back to source quality, scoring logic, ICP fit, buyer role, urgency, and the context sales receives at handoff.
This is also why we prefer downstream optimization signals over raw lead volume. For Cloudvisor, we mapped the funnel from form submission through MQL, SQL, Opportunity, and Closed-Won, then fed key HubSpot conversion events back into Google Ads. MQL-to-SQL conversion increased by 130.3%, while Opportunity volume grew by 50%.
SQL to Opportunity and Opportunity to Closed-Won
These stages show whether qualified demand can actually become revenue. A higher form-fill rate means little if SQLs stop progressing or win rate falls downstream.
When SQL-to-opportunity or close rate is weak, acquisition may no longer be the main bottleneck. We look at ICP fit, pricing, buying committee complexity, product fit, sales process, proof, and implementation risk before pushing more budget into the top of the funnel.
How We Use Benchmarks Across SaaS Motions
The same funnel metric can carry very different weight depending on how the product is sold. When we choose benchmarks, we start with the SaaS motion and focus on the conversion points that best reflect progress toward revenue.
A PLG product can have healthy acquisition and still struggle because users never reach activation. An enterprise SaaS company may convert fewer visitors at the top of the funnel but create stronger pipeline from a smaller number of high-fit accounts. The benchmark only makes sense in the context of the motion.
How We Diagnose a Funnel Against Benchmarks
Once we know which metrics matter for the motion, we use them to narrow the diagnosis rather than optimize every weak-looking number at once.
- Start with the stage closest to revenue that looks weak. Work backward from pipeline before chasing more top-of-funnel volume. A drop in SQL-to-opportunity usually deserves attention before a small visitor-to-lead gap.
- Match each metric to a comparable funnel stage conversion benchmark. Then check SaaS motion, traffic source, ACV, geography, and conversion definition before treating the external number as meaningful.
- Validate the gap against your own baseline. We usually prefer at least 90 days of data when volume allows it. A single month can be distorted by seasonality, campaign launches, low sample size, or a few unusually large deals.
- Find the likely cause before changing execution. A weak conversion rate can come from traffic quality, ICP fit, message match, friction, qualification, sales handoff, pricing, or product experience. The benchmark tells us where to investigate, not what to change automatically.
- Check downstream quality before calling a lift a win. Improvements in signup rate, form fills, demos, or MQL volume only matter if SQL quality, opportunity creation, CAC, and ARR hold or improve.
From Benchmark Gaps to Revenue Impact
A benchmark becomes useful only when it changes a decision. Once we identify a weak stage, we trace its effect downstream before deciding whether the fix belongs in acquisition, qualification, sales, product, or measurement.
In our work, we rarely optimize a conversion rate in isolation. A stronger top-of-funnel number is only valuable if the additional volume survives the rest of the funnel and improves pipeline economics.
A Revenue Impact Mini-Model
Take a sales-led SaaS company with 50,000 monthly visitors and a $20,000 ACV. Assume the current funnel looks like this:
- 1.5% visitor-to-lead = 750 leads
- 40% lead-to-MQL = 300 MQLs
- 35% MQL-to-SQL = 105 SQLs
- 40% SQL-to-opportunity = 42 opportunities
- 30% opportunity-to-close = 12.6 closed-won deals
At those rates, the funnel produces roughly $252,000 in new ARR per month.
Now compare three different lifts:
These numbers are illustrative, not benchmarks. The point is that a seemingly small improvement further down the funnel can create meaningful revenue without increasing traffic or media spend.
For PLG, we apply the same logic to a different chain: signup → activation → paid conversion → retention or expansion. Improving signup volume means little if users never reach the value moment that predicts payment.
What We Measure Before We Change Anything
Before we act on a benchmark gap, we check the data around it:
- Traffic context: source, brand vs. non-brand, campaign, landing page, and offer
- Stage conversion: visitor-to-lead, demo conversion, activation, MQL-to-SQL, SQL-to-opportunity, and close rate where relevant
- Quality: ICP segment, buyer role, source, sales acceptance, and opportunity progression
- Economics: CAC, payback, pipeline created, ARR sourced, and ARR influenced
- Measurement integrity: CRM stages, event definitions, attribution coverage, self-reported source, and duplicate handling
That is also why we look at paid media, landing pages, CRO, and analytics as one system. If a benchmark looks weak but attribution cannot show which campaigns create pipeline, the first task is measurement, not conversion optimization.
If the leak is still unclear, a focused PPC audit can help separate traffic-quality, post-click, and tracking problems before the team starts changing campaigns.
Turn Benchmarks Into Better Funnel Decisions
SaaS conversion rate benchmarks are useful when they help explain what is happening in your own funnel. Match the number to the right stage, traffic source, GTM motion, ACV, and conversion definition, then look at what happens downstream.
That changes the question from "Is our conversion rate good?" to "Where are we losing qualified demand, and what should we investigate first?" Sometimes the answer is traffic quality or landing page friction. In other cases, the real constraint sits in activation, qualification, sales handoff, or measurement.
At Aimers, we connect those signals across paid acquisition, landing pages, CRO, analytics, and CRM data instead of optimizing conversion rates in isolation. If your funnel is producing activity but it is unclear where pipeline is leaking, let's look at the numbers together.
FAQs
What is a good SaaS conversion rate?

What is a good SaaS landing page conversion rate?
What is a good trial-to-paid conversion rate?
Which SaaS conversion rate matters most?
Why do SaaS benchmarks vary so much?