How to A/B Test LinkedIn Ads for Better Performance

June 17, 2026
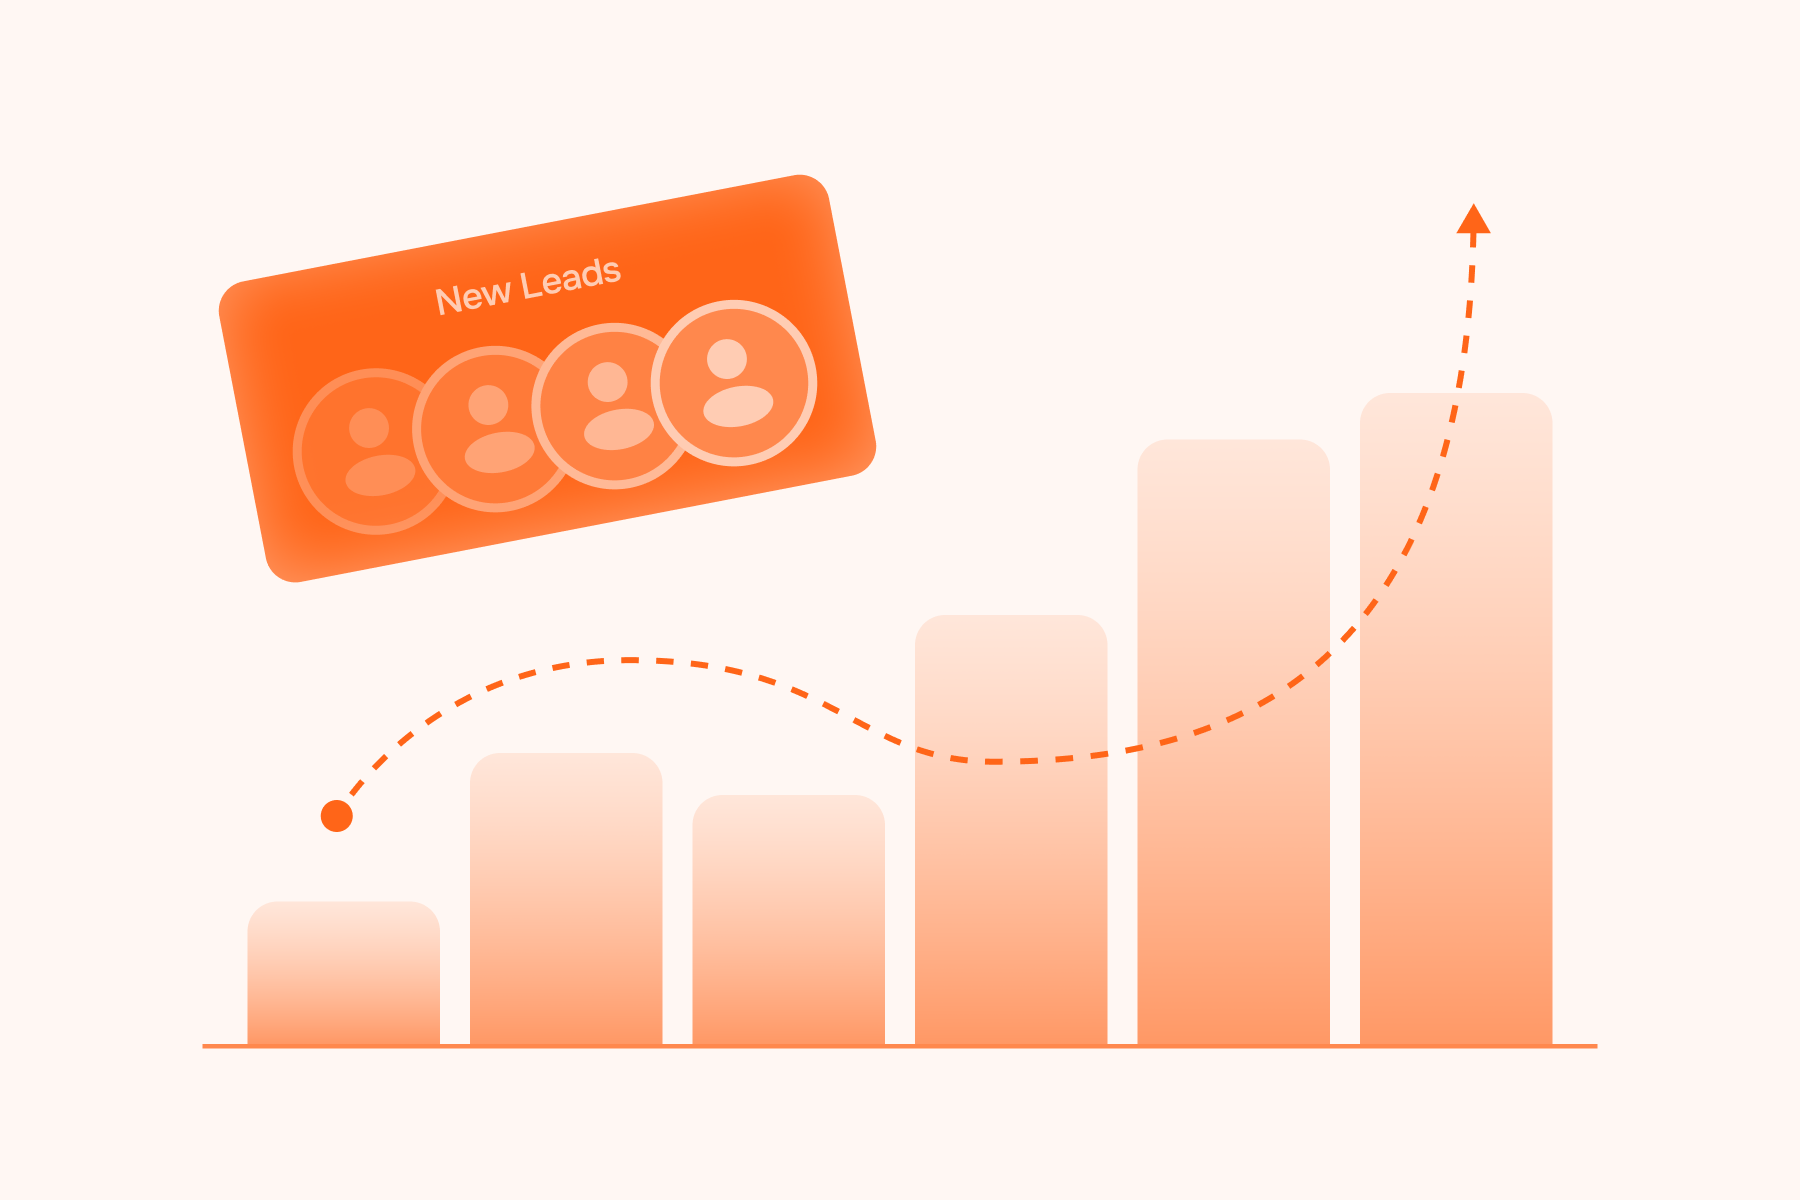
For B2B SaaS companies, LinkedIn is one of the strongest paid acquisition channels. However, it is also one of the most expensive platforms for A/B testing. With an average CPL of $75–$150, a single full-scale A/B test designed to reach statistical significance can easily cost $15,000–$30,000 per variant.
When one test can cost several thousand dollars, the real question is what to test first. In our work with B2B SaaS teams, we often see the same mistake: teams spend their budget testing minor creative changes instead of audiences, offers, and formats, which usually have a greater impact on pipeline performance.
A headline, visual, or CTA can affect CTR and CPC. But if an ad is shown to the wrong ICP segment or uses an offer that does not match the user’s intent level, such changes won’t solve the main problem. The campaign may generate more clicks without creating more SQLs, opportunities, or pipeline.
Today, we’re not going to talk about where to click the A/B test button in LinkedIn Campaign Manager. Instead, we’ll discuss how to choose the variable with the greatest potential impact, how to set up an experiment so that the results can be interpreted, and how to make decisions if your team doesn’t have the budget for ideal statistical confidence.
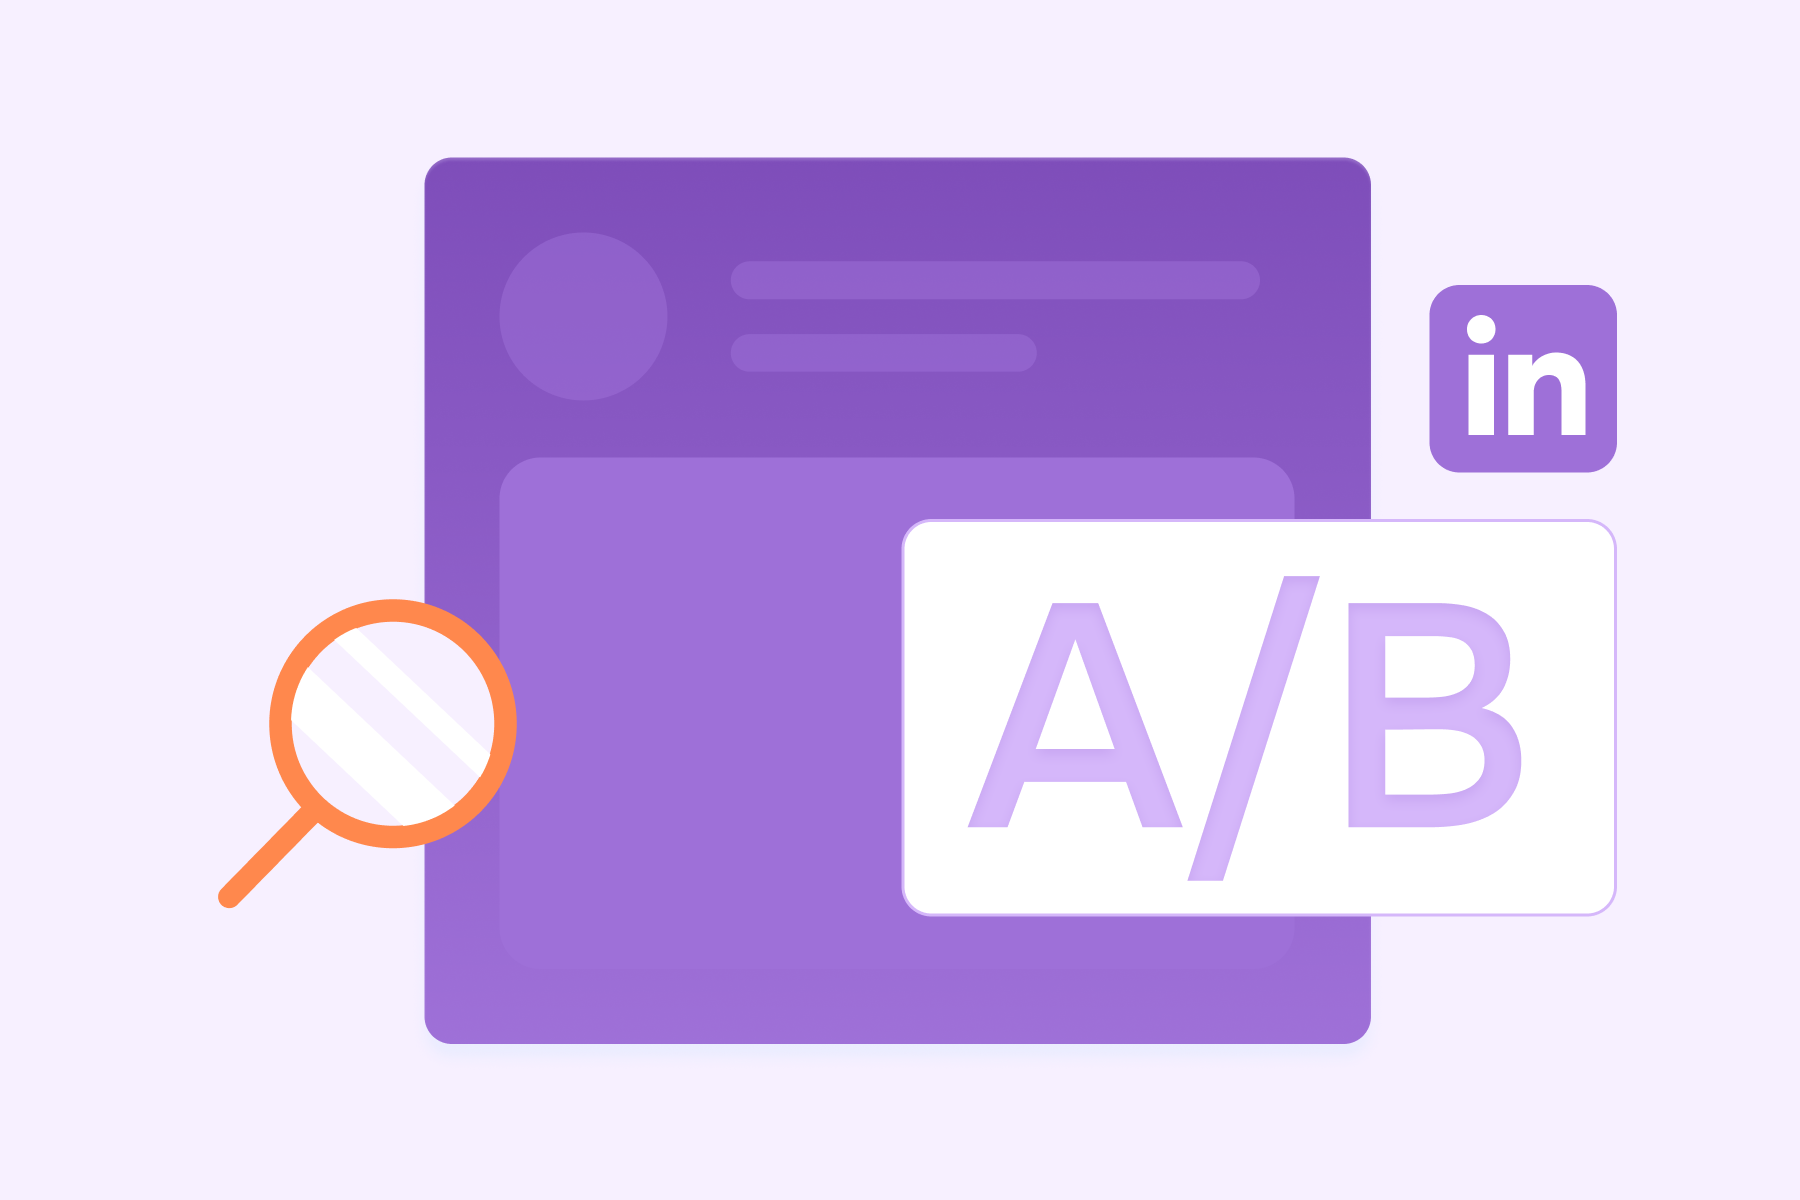
Why Most LinkedIn A/B Tests Produce Inconclusive Results
LinkedIn Campaign Manager has a built-in A/B testing tool, but LinkedIn Ads split testing still needs a clear hypothesis and enough data to produce useful results. The tool allows you to compare two campaigns with separate budgets and test one variable at a time: creative, audience, or placement. The minimum test duration is two weeks, and the maximum is 90 days. The tool is useful, but it does not solve the core testing problem on its own. Below are the most common reasons LinkedIn A/B tests become inconclusive.
Most Tests End Before the Data Becomes Reliable
A statistically reliable B2B test often requires at least 100 conversions per variant, and 200 or more conversions provide significantly greater confidence in the results. With an average CPL for B2B SaaS ranging from $75 to $150, a single test like this would cost between $7,500 and $30,000 just to reach the required number of conversions.
That is the theoretical requirement. In practice, most LinkedIn Ads experiments stop much sooner. The average CTR for LinkedIn Sponsored Content is roughly in the 0.44–0.65% range, and for single-image ads, it’s around 0.56%. With these figures, a test needs to accumulate tens of thousands of impressions before the click difference becomes statistically significant. If you choose a winner after 500–1,000 impressions, the result will usually reflect noise, not a real advantage of one variant over another.
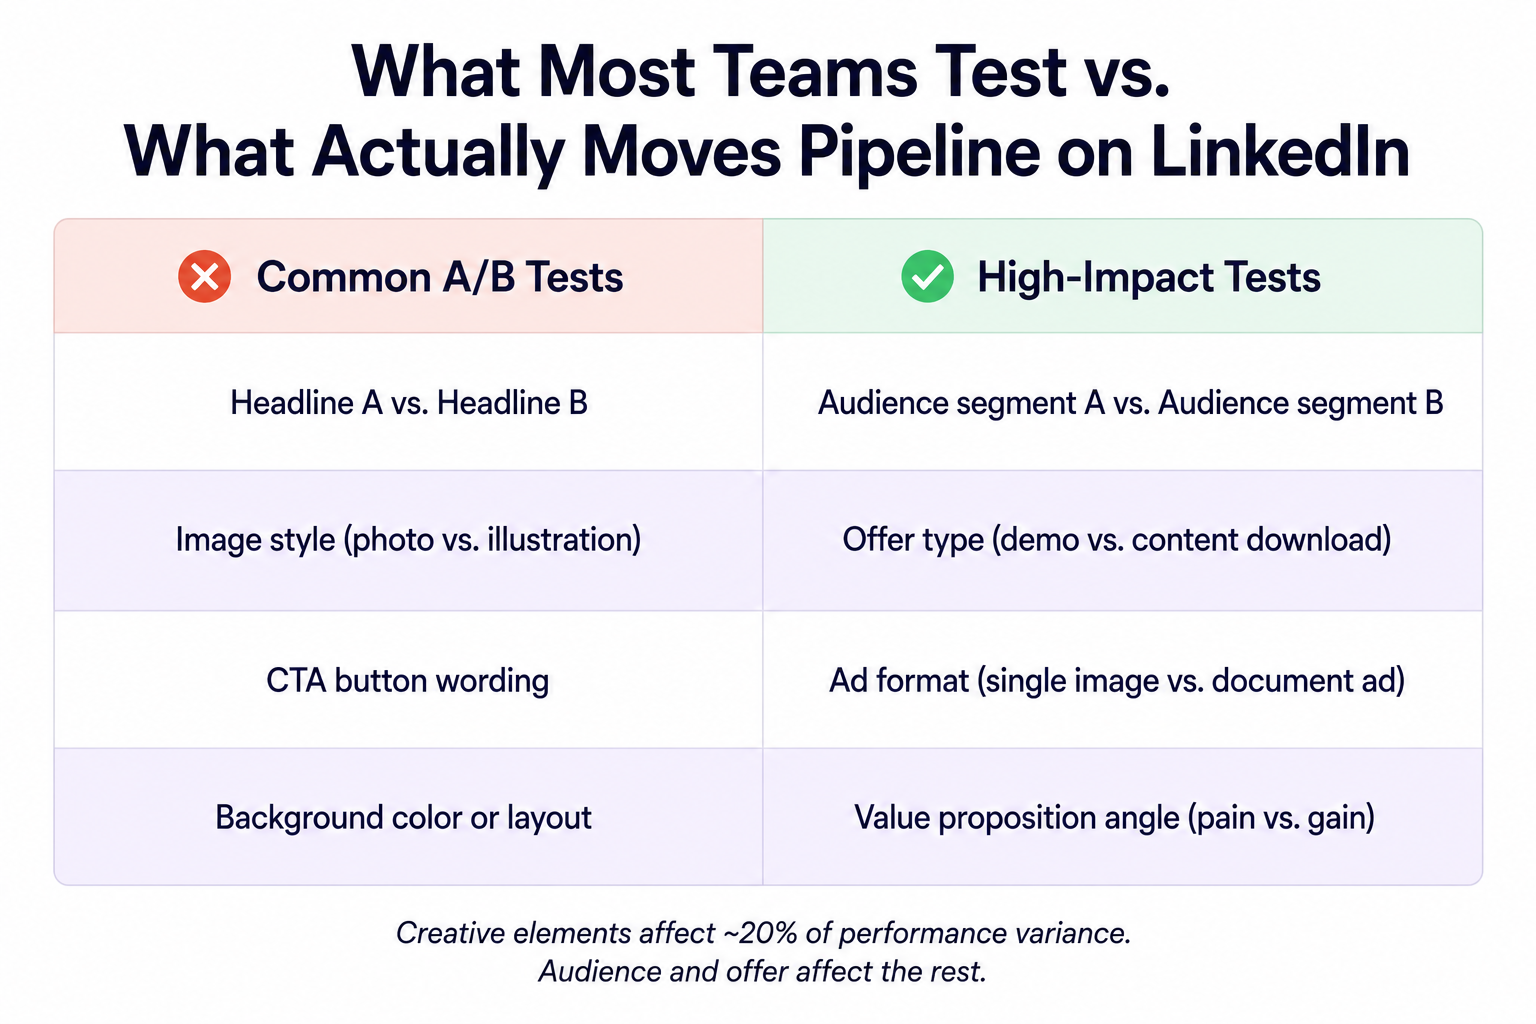
Teams Often Test the Lowest-Impact Lever
Many LinkedIn Ads creative testing plans still focus on minor creative changes:
- One headline versus another
- An image with a person versus an image without a person
- A different CTA wording
These tests can be useful, but they rarely yield the biggest performance delta. For B2B SaaS, audience and offer usually have the strongest impact. For example, the difference between two ICP segments, or between a demo request and a benchmark report, can change CPL, SQL rate, and pipeline impact much more significantly than changing a headline.
A team might spend weeks testing five headline variations and end up with a 5% difference in CTR, whereas changing the targeting segment can produce a materially larger difference. When testing LinkedIn Ads, it’s better to start with variables that actually alter audience quality and intent level rather than cosmetic changes.
What to Test First: The Variable Priority Stack for B2B SaaS
When budget, traffic, and time are limited, a LinkedIn Ads testing strategy should prioritize test order over test volume. Because LinkedIn is expensive, the B2B SaaS sales cycle is long, and statistically significant conclusions require a large volume of data, most teams will have limited data and budget. Instead of starting with minor tweaks, you should start with variables that have the greatest impact on lead quality and pipeline.
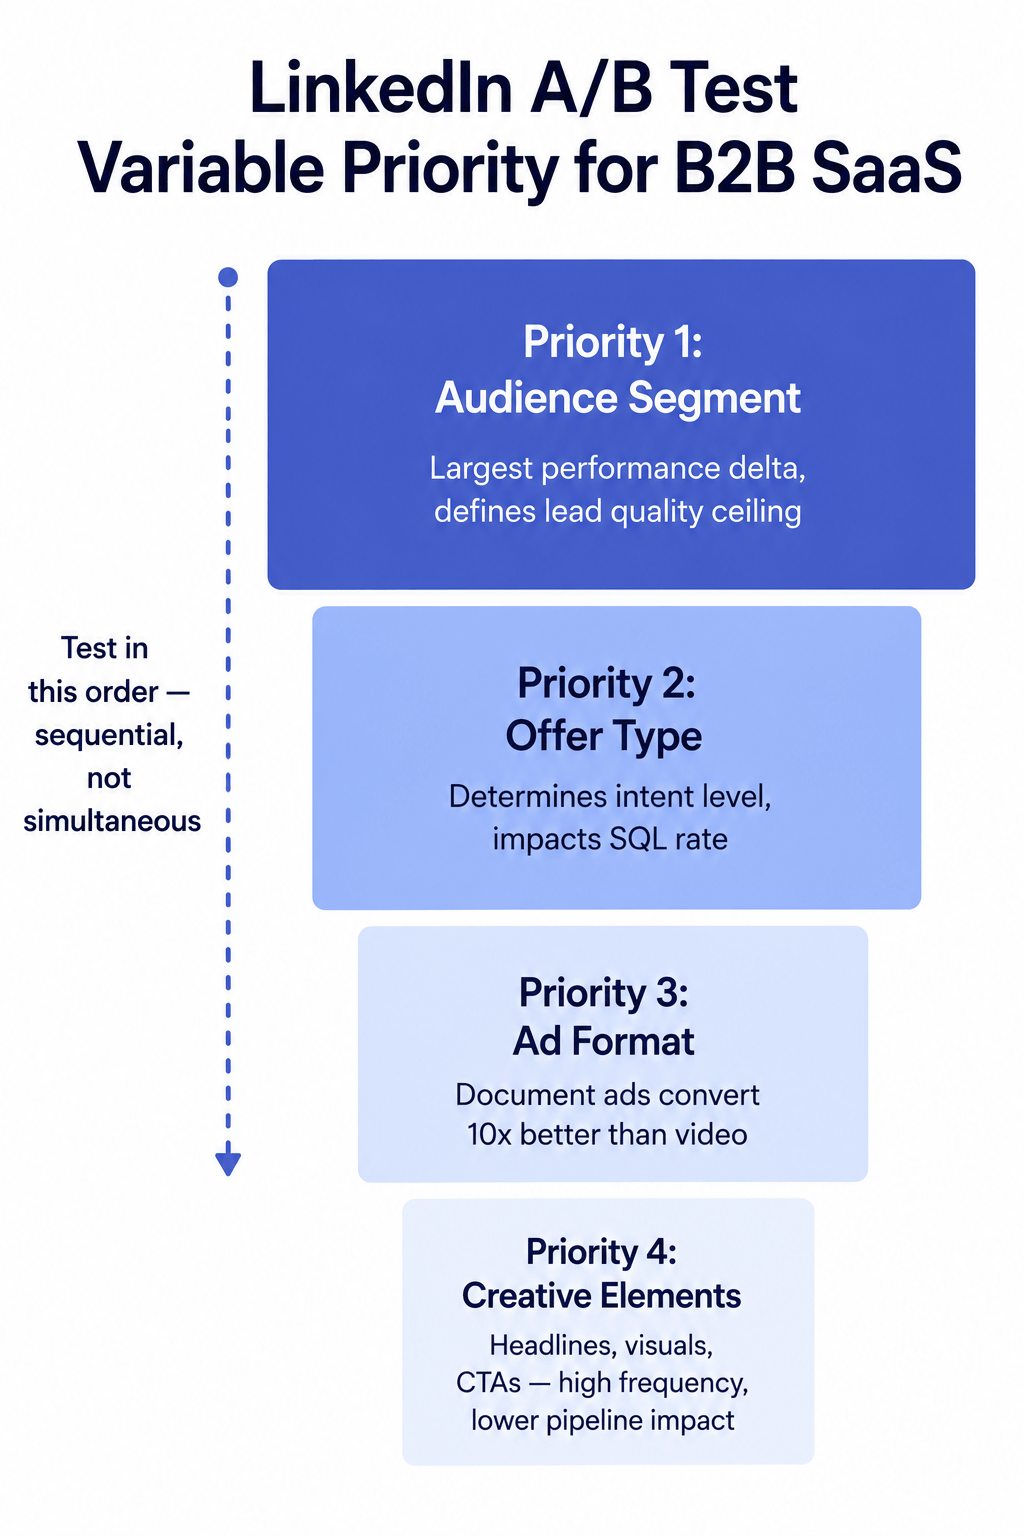
Priority 1: Audience Segment
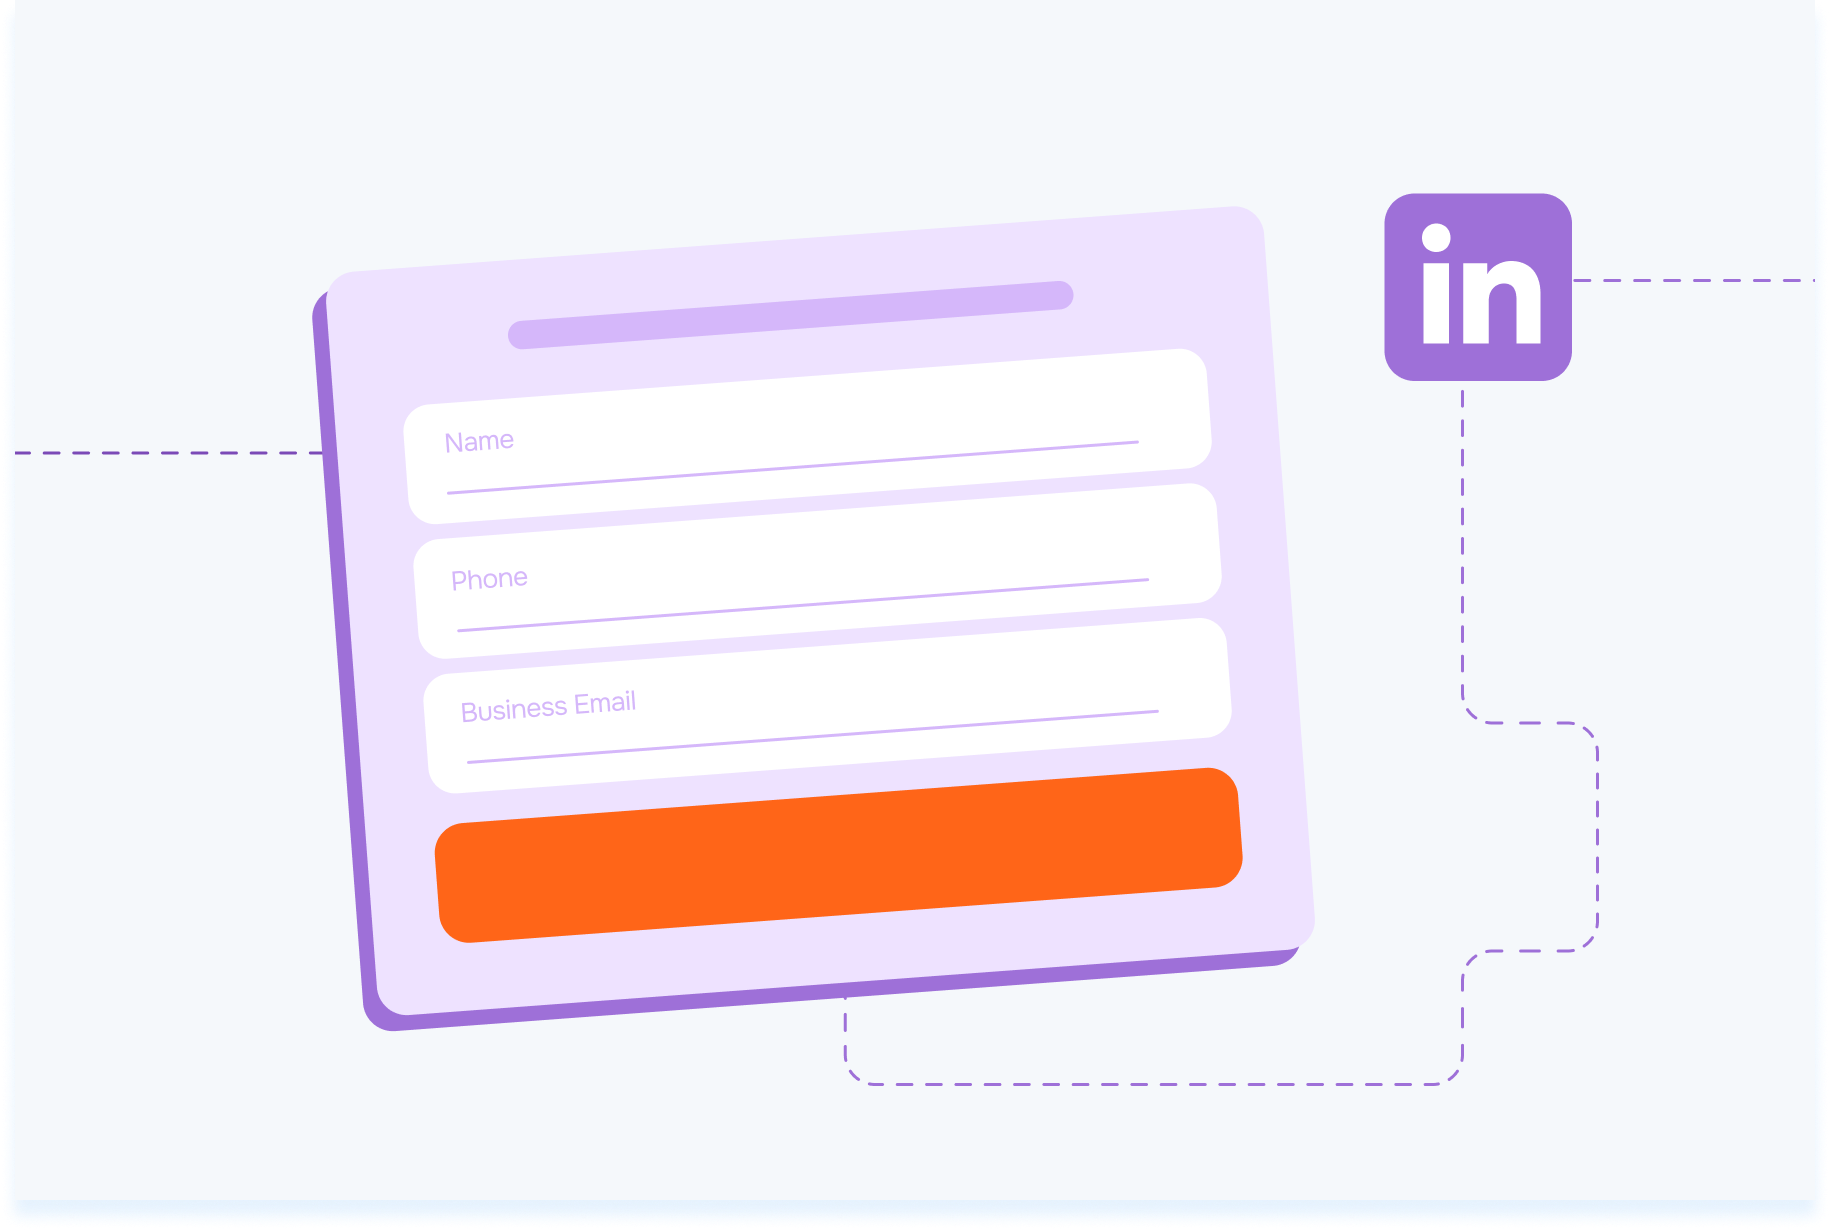
This is the variable with the largest performance delta. Companies in the top quartile for LinkedIn Ads performance use approximately 30% more audience filters than the average advertiser. LinkedIn specifically highlights Matched Audiences as a way to target more precise segments: website visitors, contact lists, and account lists. For B2B SaaS, this is more important than broad targeting because the campaign targets not just similar users, but audiences already connected to the ICP, CRM, or prior engagement.
In B2B SaaS, the same product can perform differently for a VP of Marketing, a Head of Growth, and a Head of Revenue Operations. The message may stay the same, but message fit, CPL, and SQL rate will vary because each role frames the problem differently and assesses the product’s value differently.
This is why audience testing should come first. Audience sets the bar for lead quality. If the segment is chosen incorrectly, the format and creative will end up optimizing an already weak traffic flow.
Priority 2: Offer Type
The type of offer determines who clicks and how strong their intent is. Demo requests, gated reports, webinars, and free trials bring different lead types into the CRM. Although a content-based offer may result in a lower CPL, it attracts an audience that is still in the research phase. Demos and trials typically generate fewer leads, but they are closer to actual commercial intent.
For a SaaS team, an offer should not be evaluated solely by form conversion or CPL. The stronger question is what type of lead the offer creates: MQLs, SQLs, demo bookings, and opportunities. Sometimes, a more expensive offer is more effective because it reduces the workload on SDRs and fills pipeline faster. Many teams overfocus on audience and underinvest in offer quality.
Priority 3: Ad Format
Once the audience and offer are defined, select the format that can deliver the message most effectively. Document, single-image, video, and Thought Leader Ads serve different purposes. Document ads often perform better for educational and mid-funnel content, video ads are useful for building brand awareness, and Thought Leader Ads help build trust by featuring an expert or founder.
The format affects not only CTR but also how the user perceives the offer itself. A report presented as a document ad versus a single-image ad can yield different levels of engagement because in the document ad, the user immediately receives value on LinkedIn, while in the single-image ad, they only see a prompt to click through.
According to the ZenABM 2026 Report, based on data from 211 B2B companies and $5.5 million in advertising spend, Thought Leader Ads (TLAs) achieve a CTR of 2.68% and a CPC of $2.29, outperforming single-image ads on both reported metrics.
Priority 4: Creative Elements
Headlines, visuals, body copy, and CTAs are important. However, they usually refine an existing strategy rather than changing it completely. Testing five headline variations before validating the audience and offer means allocating your budget toward minor optimizations before confirming the main hypothesis.
LinkedIn Ads optimization testing should run inside a validated framework: defined audience, suitable offer, and proven format. Then, changes to the headline, visual angle, or CTA can help improve performance rather than mask a higher-level problem.
The core rule is to test one significant variable at a time. If audience, offer, format, and creative change at the same time, it’s impossible to interpret the results properly. The campaign may identify a winner, but the team won't know exactly what worked. Instead of testing everything at once, it’s better to proceed step by step:
- Audience: Identify the most relevant ICP segment
- Offer: Select an offer with the appropriate level of intent
- Ad format: Choose the format that best conveys the offer
- Creative elements: Optimize the headline, copy, visuals, and CTA within a combination that’s already performing well
How to Set Up a Valid LinkedIn A/B Test
Choosing the variable is only half of LinkedIn Ads campaign testing. The other half is the setup. If the team distributes impressions unevenly, changes multiple variables simultaneously, or evaluates the results based solely on CTR, the test will quickly lose its practical value. Instead of providing a reliable basis for decision-making, the test will yield only a set of observations from which it is difficult to draw a clear conclusion.
Start With a Clean Test Structure
The practical question of How to test LinkedIn Ads starts with structure. There are two ways to run an A/B test on LinkedIn. The first is the built-in A/B testing tool in Campaign Manager, which was mentioned earlier.With this tool, you can create two campaigns with separate budgets, allocate impressions between variants, and test a single variable, such as creative, targeting, placement, or whether to include LinkedIn Audience Network in the setup. This is the cleanest option if you need to compare two hypotheses with less delivery interference.
The second method involves manually testing by duplicating a campaign and changing a single variable. It offers more flexibility but requires closer monitoring. Even with identical budgets, LinkedIn may gradually allocate more impressions to the variant that starts showing better results earlier. Therefore, in a manual test, it’s not enough to simply look at the final report at the end of the period. It's important to track metrics daily and check whether one variant has received significantly more impressions, clicks, or spend. Otherwise, the "winner" may not be the stronger hypothesis, but the variant toward which the algorithm directed more traffic.
Budget for Signal, Not Noise
Budget requirements depend on the confidence level needed to make a decision. The minimum budget for obtaining directional insight (not strict statistical significance, but enough signal to make a practical decision) is $1,500–$2,000 per variant for a low-cost conversion event. If the CPL is already at $150 or higher, a more realistic minimum is $3,000–$5,000 per variant. Otherwise, the test may end before enough data is collected to make a meaningful comparison.
Measuring What Actually Matters
For LinkedIn Ads performance testing, do not evaluate results based on a single metric. Read a sequence of signals. CTR shows whether the audience notices and responds to the ad. CPL shows how much the initial conversion costs. For teams using Conversion rate optimization services, the next question is whether those conversions become qualified. The MQL rate distinguishes between low-cost and qualified leads. Cost per SQL shows which variant is closer to pipeline.
Choosing a winner based solely on CTR can be misleading. A broader target audience, a simpler offer, or more provocative creative may generate more clicks, but they don’t necessarily lead to higher-quality leads. In B2B SaaS, the winning option should not be the one with the highest CTR. It should be the variant that performs best across the funnel, from click to MQL, SQL, and the next step in the sales process.
Among Aimers’ own LinkedIn Ads examples, RecMan shows why this matters. As part of our work with Google Ads and LinkedIn, we implemented systematic A/B testing combined with data-driven optimization. The result was a 65% reduction in CPA and a 93% increase in the MQL conversion rate.
The tests only began to deliver value after proper conversion tracking was set up. Without it, the team could see the CTR and CPL, but didn’t understand which option was generating MQLs. With CRM-level tracking, A/B tests became a decision-making tool rather than just a way to choose the ad with the best high-level metrics.
Reading Results and Acting on Them: From Test Data to Campaign Decisions
After running the test and collecting all the data, you need to decide how to interpret it and what to do next: scale up, stop, repeat the test, or revise the hypothesis. At this stage, it’s easy to overestimate or underestimate the significance of the results. Complete certainty is not a realistic operating assumption.
Statistical Significance vs. Practical Decision-Making
When A/B testing LinkedIn Ads, absolute statistical certainty is often unattainable. In A/B testing, a 95% confidence level is considered the standard threshold; however, B2B SaaS campaigns do not always generate enough data to reach this threshold without a significant increase in budget. Therefore, in practice, teams typically use statistical calculators to estimate the confidence level and make decisions based on the magnitude of the effect, the potential risk, and the cost of further testing.
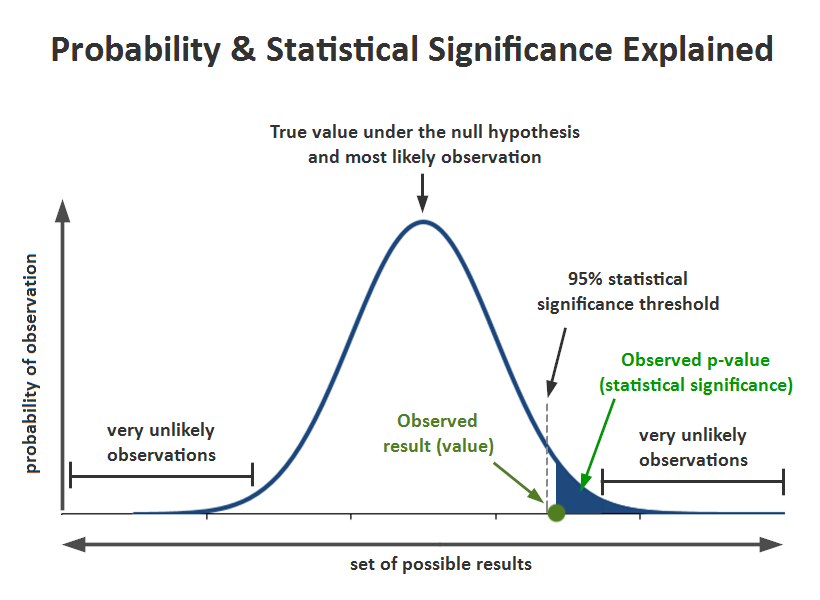
If a test shows a small difference in CTR with a low data volume, it’s best not to declare a winner. If one variant yields a significantly lower CPL without compromising the MQL rate, it can be used as a directional winner and tested in the next iteration. This approach is better than waiting for absolute certainty or, on the other hand, choosing a winner based on gut feeling.
Measure Pipeline Impact, Not Clicks
The success metric should include more than just CTR. For B2B SaaS, it’s more important to look at the entire pipeline:
A higher CTR may mean that the ad attracted more attention, but it does not guarantee a high-quality pipeline. Broad targeting, a low-commitment offer, or a message that’s too general can boost the CTR while simultaneously lowering lead quality.
A Winning Test Is Not a Permanent Winner
A LinkedIn Ads personalization test shows that results should be evaluated based on the magnitude and duration of the effect.
In the second half of 2025, tests showed that dynamic personalization could significantly reduce CPL: by more than 20% in global campaigns and by 33% in the U.S. In these tests, data from users' profiles (e.g., name, company, or job title) was automatically inserted into the ads.
However, after about a month of using the same variations, the campaigns started showing signs of creative fatigue. Users were seeing the same personalized content too often, and performance began to weaken. This example highlights two points: personalization can deliver measurable gains, but even a winning approach needs regular refreshes.
This is an important principle for interpreting results. The winning variant does not become a new, permanent standard. Instead, it becomes the next working hypothesis that needs to be scaled, monitored, and updated when performance begins to decline.
Systematic testing yields results not through a single successful experiment but through the accumulation of small improvements. If you test the audience, offer, format, and creative consistently over six months, your team will better understand what drives the product’s performance. In this context, reducing CPL by 30–40% over several iterations can be a realistic goal, but it is a practical expectation, not a universal benchmark.
Turn Test Results Into Institutional Knowledge
Documentation is the final layer. LinkedIn Campaign Manager only stores data for a limited time, so the context of a test is often lost faster than the numbers themselves. Record the hypothesis, settings, test period, results, decisions, and next steps separately in a CRM, internal knowledge base, or simple spreadsheet.
Without documentation, teams end up retesting validated ideas every quarter. A LinkedIn marketing agency should treat every test as reusable account knowledge, not a one-off campaign report. With a documented history of A/B tests, A/B testing becomes a repeatable learning system rather than a series of isolated experiments.
LinkedIn A/B Testing Framework for B2B SaaS: Summary Table
The Top LinkedIn Ads agencies do not treat every variable as equally important. A good LinkedIn A/B testing framework helps the team understand which variables actually impact performance, in what order to test them, and which metrics to use when making decisions.
For B2B SaaS, it’s especially important not to start with minor creative edits. If the audience is wrong or the offer doesn’t match the stage of the sales funnel, the headline and visuals alone won’t improve lead quality. Testing should proceed from the top down: first the audience, then the offer, then the ad format, and only then the creative elements.
To reach strict statistical significance at the 95% confidence level, these budgets often need to increase by about 3–5 times. In our experience, a different model works better for most B2B SaaS teams: directional testing, a confidence threshold of around 80%, sequential testing of variables by priority, and mandatory integration with the CRM.
CRM integration is what separates a useful LinkedIn A/B test from a surface-level Campaign Manager report. CTR and CPL help assess top-of-funnel performance, but the decision to scale must be based on the MQL rate, SQL rate, and cost per SQL. Otherwise, the team risks choosing an option that acquires leads more cheaply but builds a weaker pipeline.
The operating logic is simple:
- Define your hypothesis before launching
- Test one significant variable at a time
- Evaluate the results further down the funnel
- Document your findings
With this structure, LinkedIn A/B testing becomes not just a one-time test of creative assets, but a system for accumulating knowledge about which audiences, offers, and formats actually work for a specific SaaS product.
As a SaaS digital marketing services provider, we help B2B SaaS teams turn LinkedIn Ads testing into a repeatable optimization system, connecting campaign experiments to CRM data, SQL rate, cost per opportunity, and pipeline quality.
FAQs
What Should You A/B Test First in LinkedIn Ads?
How Long Should a LinkedIn Ads A/B Test Run?
How Much Budget Do You Need for LinkedIn Ads A/B Testing?
Which Metrics Matter Most in LinkedIn Ads A/B Testing?
Do LinkedIn Ads A/B Tests Need Statistical Significance?

February 24, 2025