

What Is B2B Revenue Marketing: Strategy and Metrics for SaaS

September 30, 2026

At Aimers, one of the most revealing numbers in a paid campaign often sits outside the ad platform: how many of its leads sales actually accepts. A falling CPL can look reassuring until the pipeline review shows the same number of opportunities, or fewer. Marketing, sales, and finance may each have an accurate report and still disagree about whether the spend is working.
The gap begins before a buyer fills out a form. In 6sense’s 2025 study of nearly 4,000 B2B buyers, first seller contact came 61% of the way through the buying journey, while the winning vendor was already on the initial shortlist in 95% of purchases. That pattern suggests a demo request captures only the visible portion of a longer decision. On its own, it tells you little about how the account formed its preference or whether the eventual customer will repay the cost of acquisition.
Revenue marketing helps SaaS teams connect those stages. It starts with targets built from ARR, follows demand into qualified pipeline and customers, and uses CRM feedback and retention data to judge where growth is worth funding. Below, we’ll show how to build that B2B revenue view and use it when the next budget decision comes around.
Quick Highlights
Revenue marketing connects SaaS marketing investment to qualified pipeline, won revenue, and customer growth.
- Plan backward from ARR. A B2B marketing revenue strategy translates a new-logo target into customers, opportunities, and sales-accepted leads using the company’s own conversion rates.
- Follow leads beyond the form. CPL can flag a campaign issue; sales acceptance, opportunity creation, win rate, and CAC payback show whether the resulting demand is worth scaling.
- Give attribution a defined job. Report sourced and influenced pipeline separately, and add buyer-reported discovery to the interactions the CRM can track.
- Build the revenue marketing feedback loop first. Use the first 90 days to align funnel stages, connect CRM outcomes to campaigns, and act on pipeline quality. Assess payback and retention as customer cohorts mature.
What Is Revenue Marketing?
Revenue marketing is an approach to planning and evaluating marketing by its contribution to qualified pipeline, recurring revenue, and customer growth. For B2B SaaS companies, that means following what happens after a lead enters the CRM: whether sales accepts it, whether it becomes an opportunity and a customer, and whether the revenue justifies the cost of acquisition.
That view requires alignment on definitions across marketing, sales, RevOps, customer success, and finance. A campaign may meet its CPL target while producing few opportunities. Revenue marketing makes that gap visible early enough to change targeting, qualification, follow-up, or spend.
The customer lifecycle matters too. In Benchmarkit’s 2026 B2B SaaS and AI-native benchmarks, expansion accounted for 40% of net new ARR at the median. Marketing can support adoption and expansion, while customer success and product remain central to those outcomes. Acquisition reports alone cannot show whether the customers a program attracts become valuable accounts.
Revenue Marketing vs. Demand Generation and Campaign Reporting
These approaches answer different management questions. Demand generation can already be accountable for qualified pipeline; revenue marketing extends the shared view through sales conversion and customer economics.
A SaaS team needs all three views. Campaign data helps diagnose performance, pipeline data shows whether demand progresses, and revenue data shows whether that progress supports the business plan.
How to Set B2B Marketing Revenue Goals for SaaS
A B2B marketing revenue strategy starts with the ARR plan and works backward to the customers, opportunities, and qualified demand needed to support it. The calculation also tests whether the target fits the company’s conversion rates, sales cycle, and capacity before the team commits more budget.
Translate the ARR Target Into Opportunities
To turn revenue marketing into a usable plan, separate new-logo ARR from expansion ARR, then agree on marketing’s share of new-logo revenue. Use historical rates for the relevant customer segment rather than one companywide funnel average.
Suppose a SaaS company targets $2 million in new-logo ARR at an average annual contract value of $20,000. It needs 100 new customers. At a 25% opportunity win rate, that implies 400 qualified opportunities. If the agreed marketing-sourced share is 60%, marketing’s portion is $1.2 million in ARR, 60 customers, and approximately 240 opportunities.
Keep working backward. If 40% of sales-accepted SQLs become opportunities, 240 opportunities require 600 SQLs. If 20% of demo requests become SQLs, the target rises to 3,000 requests. These are illustrative assumptions, not SaaS benchmarks. A number that exceeds likely buyer demand or sales capacity tells the team to inspect conversion, ACV, qualification, and timing before increasing spend.
.png)
Agree on Stage Definitions Before Setting Team Targets
Marketing and sales need to count the same progression. For this plan, an MQL could require ICP fit and a documented buying signal; an SQL would be a lead sales accepts for active follow-up. An opportunity should have an identified need, commercial potential, a plausible buying process involving the right stakeholders, and a next step.
Document who accepts or rejects each record, how quickly follow-up happens, and where rejected leads go. Otherwise, a change in MQL-to-SQL rate may reflect a new definition or a routing problem rather than a change in campaign quality.
Set Pipeline Coverage Against Win Rate and Deal Timing
Pipeline coverage is qualified opportunity value expected to close in a period divided by the revenue target for that period. At a 25% win rate, the starting requirement is 4× coverage; at 20%, it is 5×. These are calculations from win rate, not targets to copy across every segment.
For the illustrative $1.2 million marketing-sourced ARR target, 4x coverage implies $4.8 million in qualified opportunity value with a credible path to closing in the target period. Check deal age, stage, and close date before counting it. If the sales cycle runs beyond the planning period, some of that pipeline must be created earlier.
The same waterfall can inform a PPC budget: estimate the opportunities a paid channel needs to contribute, then compare the required spend with observed conversion and payback. Budget decisions become easier to defend when every assumption can be checked against CRM results.
Which B2B Marketing Revenue Metrics Show Progress Toward ARR?
Revenue marketing metrics should show how campaign spend progresses through sales acceptance, qualified opportunities, won ARR, and customer retention. Platform metrics reveal where performance changes; CRM and finance data show whether those changes improve the business. A lower CPL deserves investigation if the leads behind it rarely become opportunities.
Build the Revenue Marketing Dashboard Around Stage Progression
Use the same segment, source rules, and reporting period when comparing stages. Otherwise, a channel can appear efficient in the ad platform and weak in the CRM simply because the two reports count different people or different time windows.
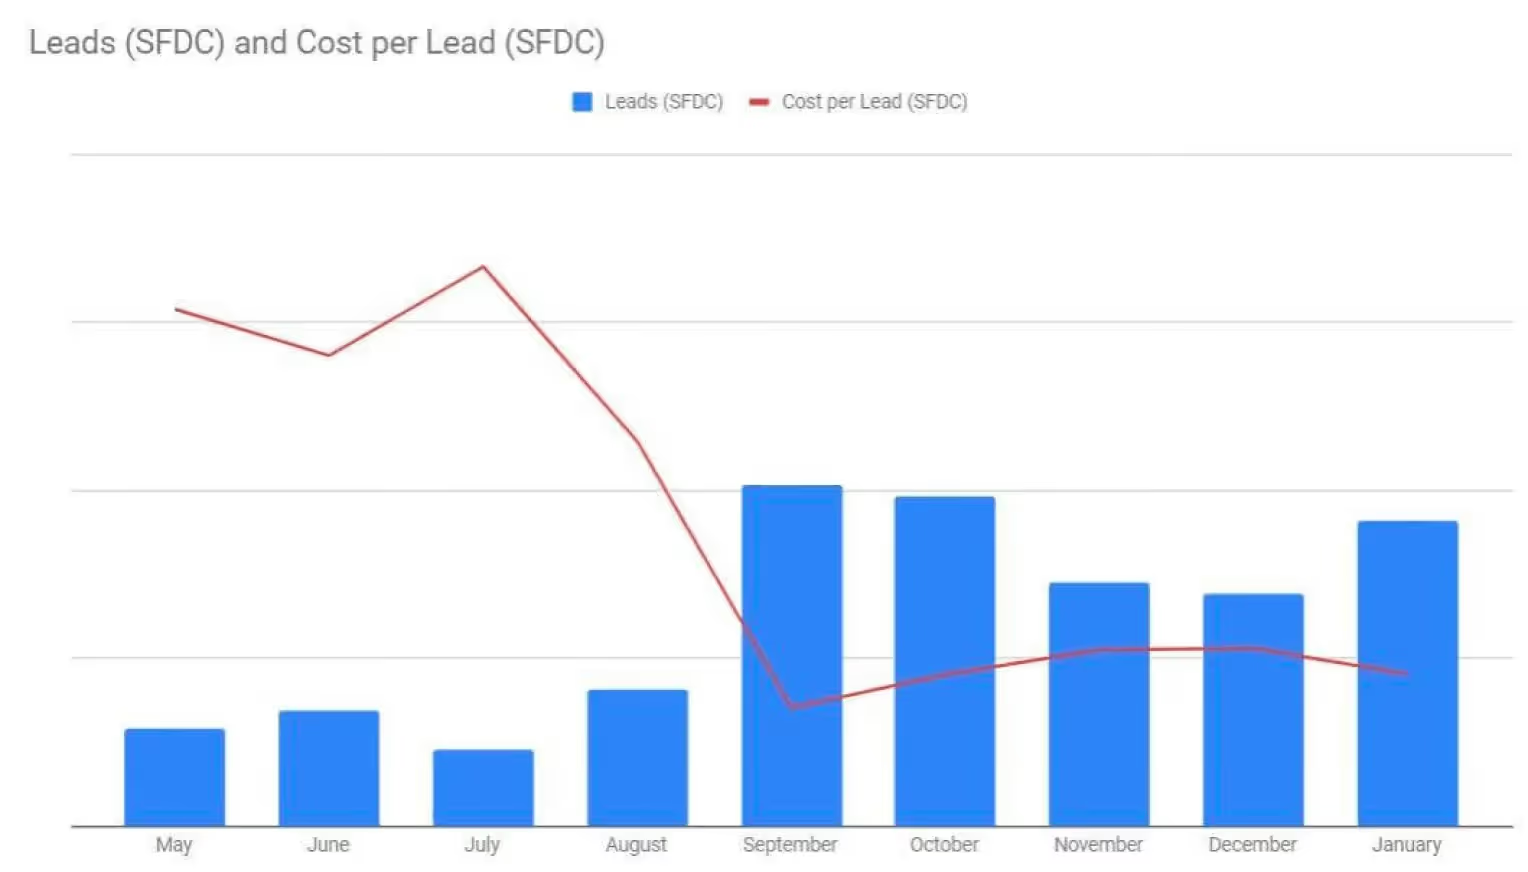
The transition from campaign response to lead quality is easy to miss when tracking breaks. In our work with Mixpanel, inconsistent UTMs made it difficult to identify which LinkedIn campaigns generated qualified leads in Salesforce. Aimers standardized tracking and compared campaign data with Salesforce records while also changing campaign structure, targeting, and remarketing.
Across that broader program, qualified leads increased 164% in the first six months, while CPL decreased 67%. The results support measuring qualified demand by campaign, though the case does not report opportunities or won ARR.
the case does not report opportunities or won ARR.
Keep Pipeline and Acquisition Economics in Context
Marketing-sourced pipeline needs an agreed rule for assigning opportunity source. Report its qualified value, then check win rate, sales cycle, and won ARR for the same segment. A channel that creates a large pipeline with a low win rate may require different targeting or qualification, even when its cost per lead looks attractive.
While deals are still open, pipeline divided by marketing spend can help compare the potential output of programs. Label the figure as a pipeline-to-spend ratio: opportunity value is not booked revenue. For actual ROI, match realized outcomes with the costs incurred to produce them. CAC should include relevant sales and marketing costs, and CAC payback should account for the gross margin those customers generate each month.
Compare Benchmarks With the Right Cohort
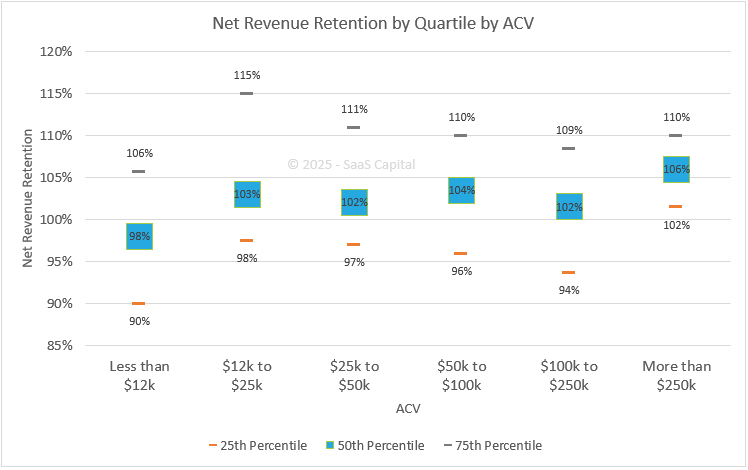
Retention benchmarks are useful when the comparison reflects a similar ACV and customer base. In SaaS Capital’s 2025 research, companies with $25,000–$50,000 ACV had median NRR of 102%, while the top quartile reached 111%. Those figures describe that ACV group, not a universal SaaS target.
GRR deserves a separate look because expansion can lift NRR while existing customers still reduce spend or leave. Benchmarkit’s 2026 B2B SaaS and AI-native report shows GRR declining from 88% to 84% across its reported periods. Compare the trend with your own cohorts before using it to revise acquisition or retention targets.
Review SaaS marketing metrics at the level where a decision can be made: diagnose campaign response quickly, assess pipeline quality as opportunities develop, and evaluate payback and retention when customer cohorts have had time to mature.
How to Attribute Revenue in a Long B2B Sales Cycle
B2B revenue attribution helps a SaaS team understand which marketing activity appears in the path to an opportunity or customer. It depends on the contacts and interactions the company can record, so first decide what the report needs to answer: where qualified pipeline came from, which programs reached buying accounts, or whether an investment changed outcomes.
Separate Sourced From Influenced Pipeline
Marketing-sourced pipeline is the value of qualified opportunities assigned to marketing under an agreed source rule. Marketing-influenced pipeline is the value of opportunities whose accounts had a recorded marketing interaction within a defined period. Keep the figures separate and document the rule and time window behind each one. An opportunity can appear in both reports, so adding the totals would double-count it.
Consider an account where an operations leader first hears about a product from a peer, a finance stakeholder later engages with a LinkedIn ad, and a third person searches for the brand before requesting a demo. Depending on the agreed rule, paid search might receive sourced credit, while LinkedIn appears as an influencing touch. The peer conversation may appear in neither report.
.png)
First-touch, last-touch, and multi-touch models assign credit differently to recorded touchpoints. They can help compare observed journeys, but their weights do not prove that a touch caused the purchase. For a major budget decision, a well-designed experiment can provide stronger evidence of incremental impact.
Account for Research You Cannot Track
B2B buying starts before many accounts identify themselves. The 6sense buyer research cited above found that the winning vendor usually appeared on the initial shortlist, well before first seller contact. The finding covers B2B purchases across industries; it is not a SaaS-only benchmark.
%20(1).png)
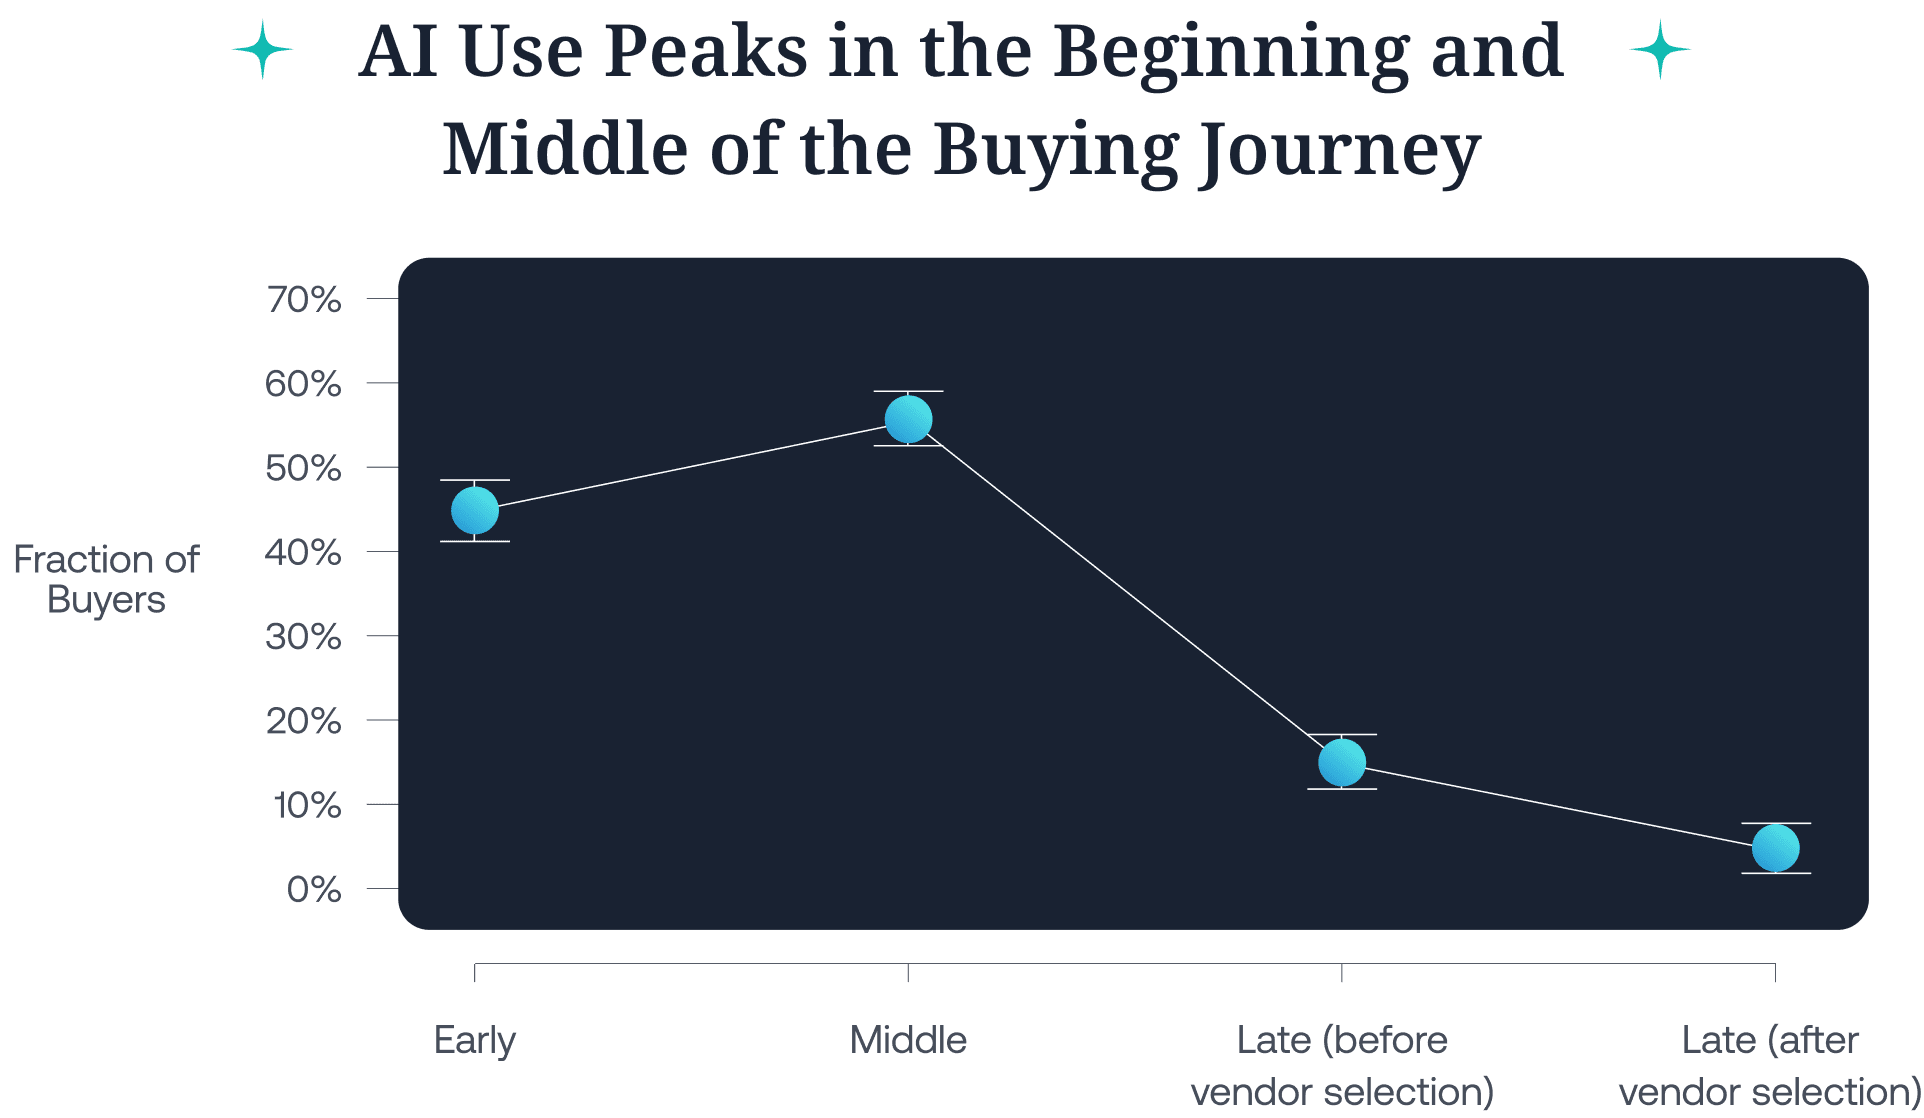
That visibility gap includes peer recommendations, private communities, forwarded content, and research through AI tools and answer engines. In the same 6sense study, 94% of buyers reported using LLMs during their buying process; the researchers also found that buyers continued to interact with vendors.
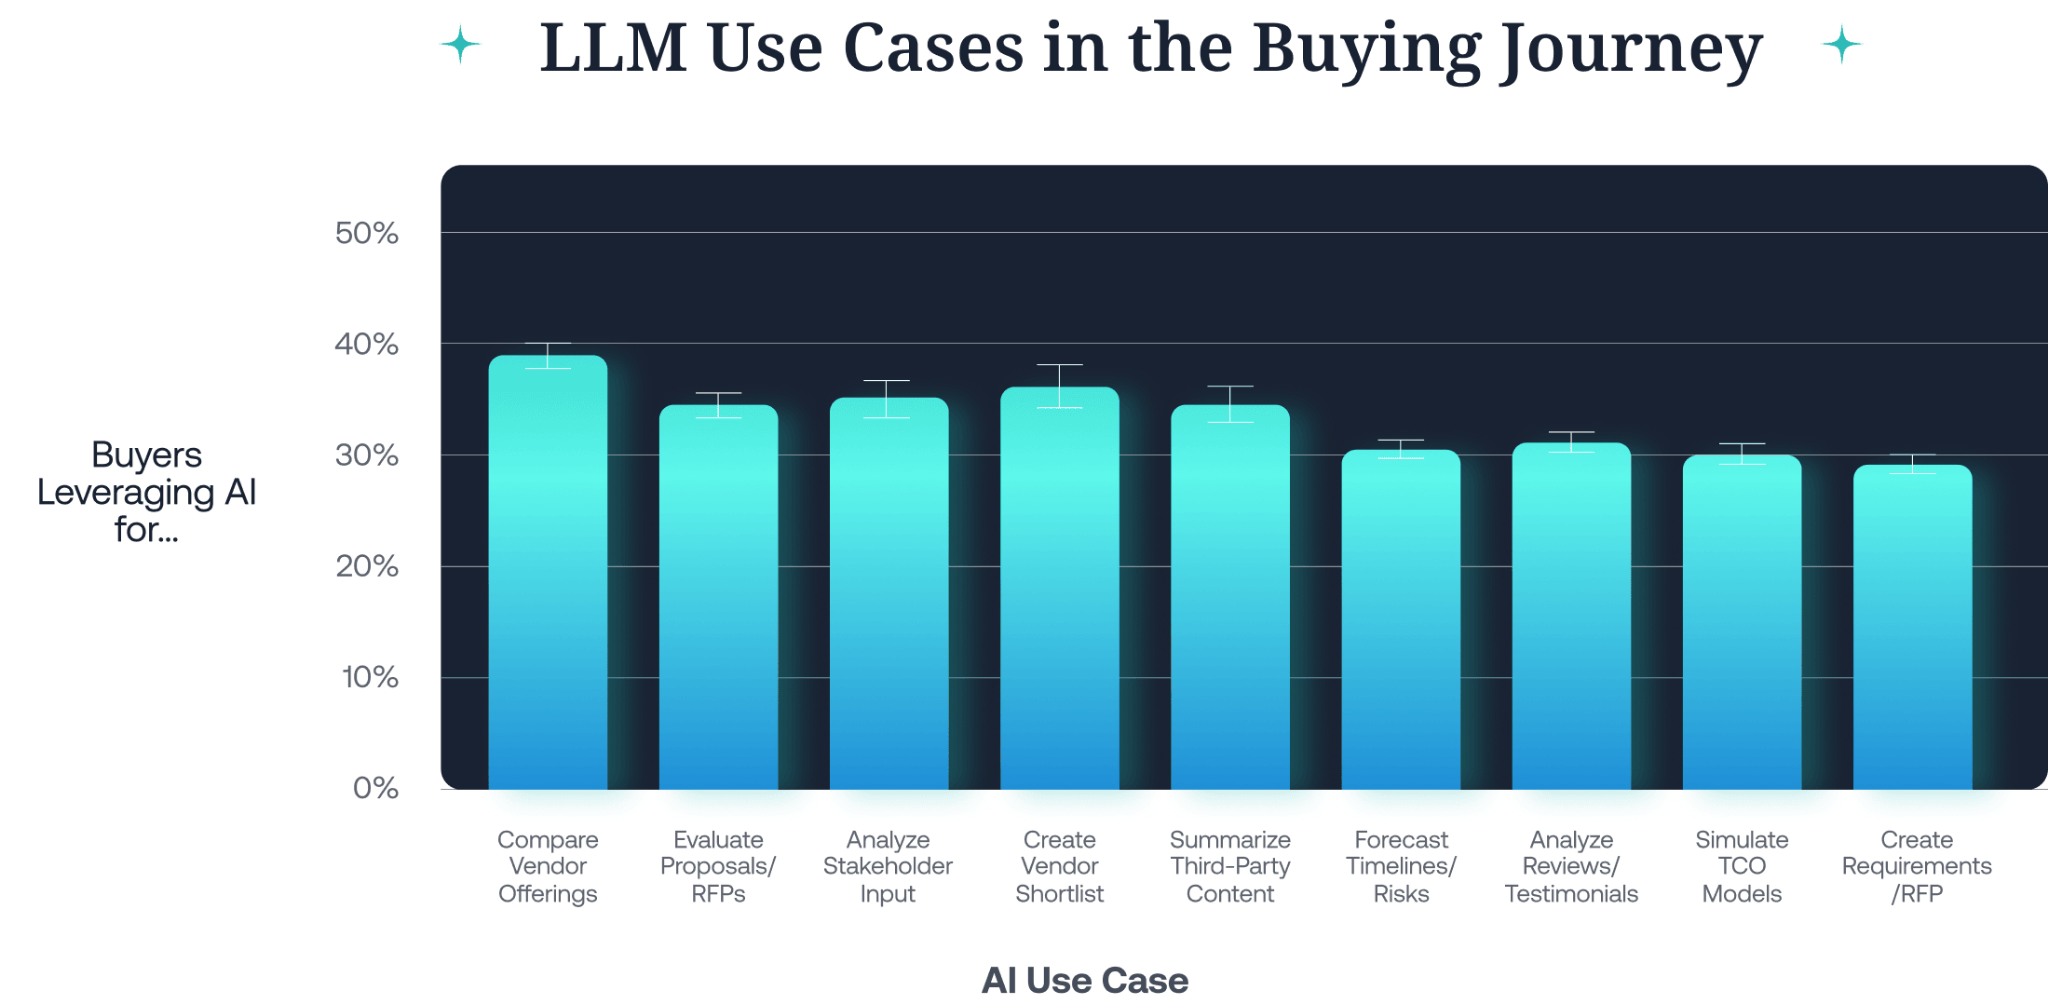
Ask “How did you first hear about us?” on a high-intent form and retain the buyer’s own wording. Have sales record useful context from discovery calls, then compare those answers with tracked activity across contacts at the account level. The result is a more informative view of the journey, even when some interactions remain unseen.
Feed Downstream Outcomes Back Into Paid Campaigns
Attribution becomes more useful when CRM stages also inform campaign optimization. Google Ads guidance supports importing offline outcomes, recommends separate conversion actions for different funnel stages, and identifies qualified or converted leads as appropriate goals for enhanced conversions for leads. That lets a team distinguish a submitted form from a lead that progressed after sales review.
In the Cloudvisor case, Aimers mapped the path from form submission through MQL, SQL, opportunity, and closed-won, then passed HubSpot conversion signals into Google Ads. Four weeks after the full-funnel optimization was implemented, MQL-to-SQL conversion rate was 130.3% higher than in the implementation week, and opportunity volume was 50% higher. Those are results from the broader optimization program; the case reports no corresponding figure for closed-won revenue.
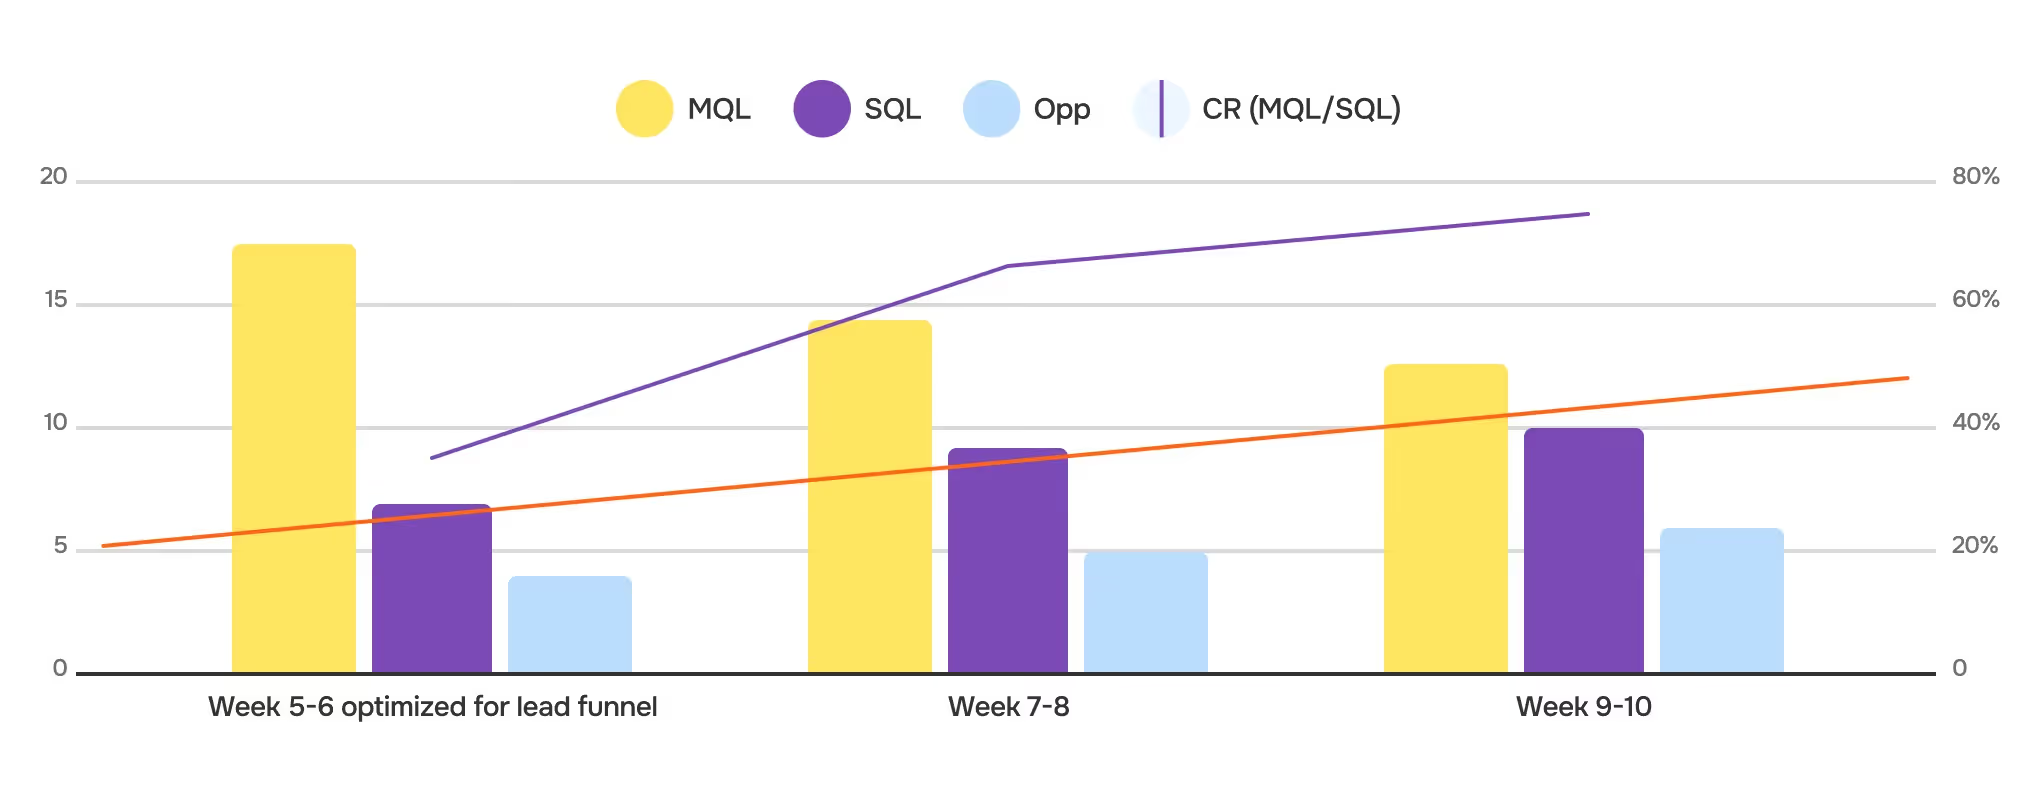
Keep the CRM as the source of truth for opportunity and revenue reporting. In a revenue marketing review, use ad-platform data to improve campaigns, and account-level reporting and experiments to examine the contribution a single attribution model can only partly describe.
How to Build a Full-Lifecycle Revenue Marketing Program
B2B revenue teams can establish the foundations of revenue marketing in 90 days by agreeing on funnel stages, connecting campaign data to sales outcomes, and using that information to change decisions. The first quarter should make weak links visible and give each team a way to act on them. Closed revenue and retention will take longer to mature for many accounts.
Days 1–30: Find Out Where the Numbers Part Ways
Start with the revenue plan: new-logo and expansion ARR, ACV by segment, opportunity win rates, and the pipeline required to support the target. Marketing, sales, RevOps, and finance should then agree on what counts as an MQL, an accepted SQL, an opportunity, and a marketing-sourced deal.
Trace a handful of recent leads from ad click or first site visit through the form and CRM. Can you identify the campaign? Did sales receive the record? If it was rejected, do you know why? These questions often tell the team more than adding another chart to the dashboard.
By day 30, have a stage dictionary, a list of broken or missing data connections, and a baseline for conversion between stages. Set SaaS KPIs against those agreed stages and the revenue target, so each measure has a reason to be reviewed.
Days 31–60: Connect the Feedback and Test One Bottleneck
Build a shared view of spend, sales-accepted leads, opportunities, qualified pipeline, and won ARR. Connect CRM qualification and opportunity outcomes to the relevant campaigns where the data is reliable enough to use. Keep the CRM record available for checking what the ad platform reports.
Then choose a test based on the largest credible loss in the funnel. If demo requests arrive but few become SQLs, inspect targeting, the offer, and sales rejection reasons. If qualified buyers reach the demo page but rarely submit the form, examine message match and friction. Our guide, Increase SaaS conversion rate, covers ways to improve that step before sending it more traffic.
The phase ends with a working report and a documented test, including its owner, success measure, and review date. More campaigns would only make an unresolved data or conversion problem harder to diagnose.
Days 61–90: Make the Review Change the Plan
Run a weekly funnel review while leads and opportunities can still be followed up. Check sales acceptance, stage conversion, aging opportunities, and missing source data. In our work, the useful outcome of this meeting is an assigned action: fix routing, revise an audience, follow up with a buying account, or change an offer.
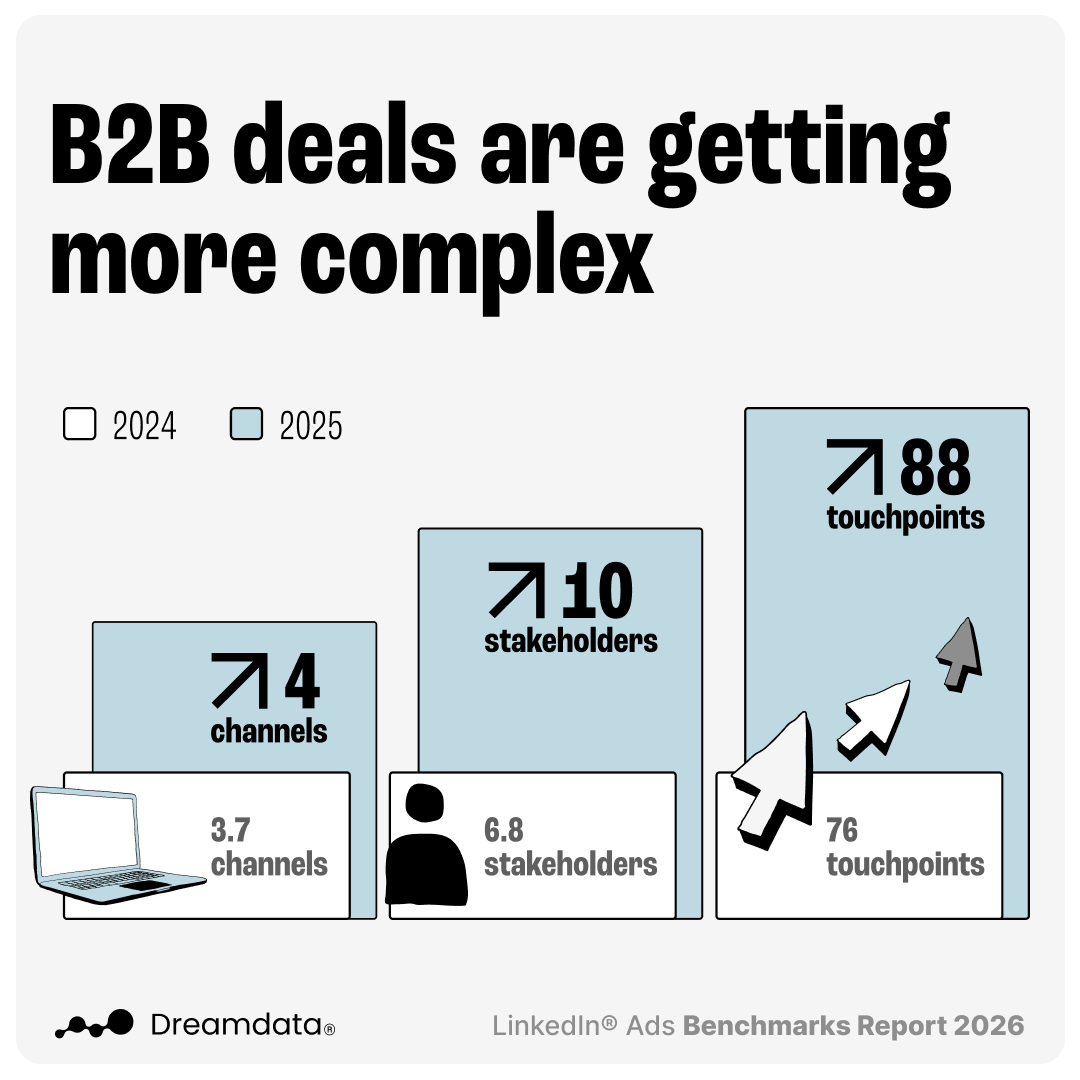
Use a monthly investment review for larger decisions. Compare spend with pipeline and revenue from sufficiently mature cohorts, then decide what to scale, repair, or stop. A 90-day window is too short to judge every campaign by closed revenue: in Dreamdata’s 2026 LinkedIn Ads analysis, the average time from first LinkedIn ad impression to revenue across its customer data was 281 days. Treat that figure as context for your reporting window; the interval will vary by channel and buying cycle.
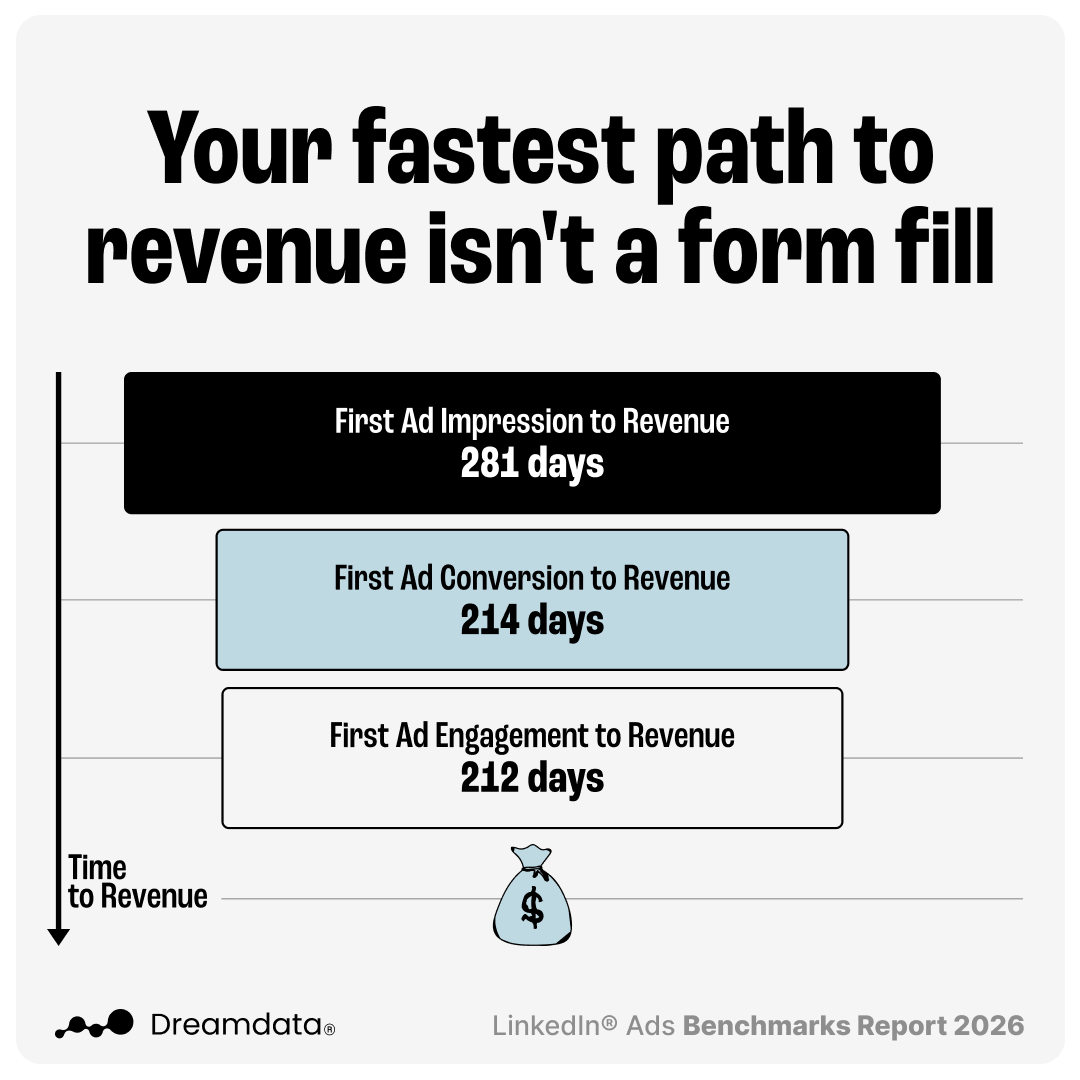
Marketing owns the programs and campaign changes; sales owns acceptance and deal progression; RevOps maintains the definitions and data flow; finance checks cost and revenue; customer success brings adoption, renewal, and expansion signals back to the group. By day 90, the team should have a repeatable decision process and an early read on pipeline quality. Later cohorts will show whether those decisions also improved payback and customer growth.
What Revenue Marketing Should Change
B2B marketing revenue reporting should give a SaaS team clearer choices about budget, pipeline, and customer quality. When lead volume climbs but opportunities do not, check buyer fit, routing, and the offer before buying more traffic. When new ARR grows but CAC payback stretches, look at acquisition cost and retention by cohort before scaling the same approach.
Shared stage definitions and CRM feedback make those decisions possible. For B2B revenue teams, a dashboard earns its place when someone uses it to change a campaign, fix a handoff, or adjust the forecast.
If paid campaigns are generating activity but the path to qualified pipeline is still unclear, Aimers can help trace where prospects drop off across ads, CRM stages, and landing pages. Explore our SaaS performance marketing work, or talk to the team about an audit of your acquisition and conversion path.
FAQs
What is B2B revenue marketing?

What is the difference between revenue marketing and demand generation?
What are the most important revenue marketing metrics for SaaS?
How do you calculate pipeline coverage?
How do you attribute marketing revenue in a long sales cycle?


.png)