How to Optimize Google Display Ads for Higher CTR

April 1, 2026

Display reaches 90% of internet users and offers some of the lowest CPMs in paid media. At the same time, average CTR is only 0.46%, and in B2B it can fall as low as 0.22%. So the question is obvious: how do you increase clicks? The problem is that there is no single fix. To optimize Display effectively, you first need to understand where performance is breaking down.
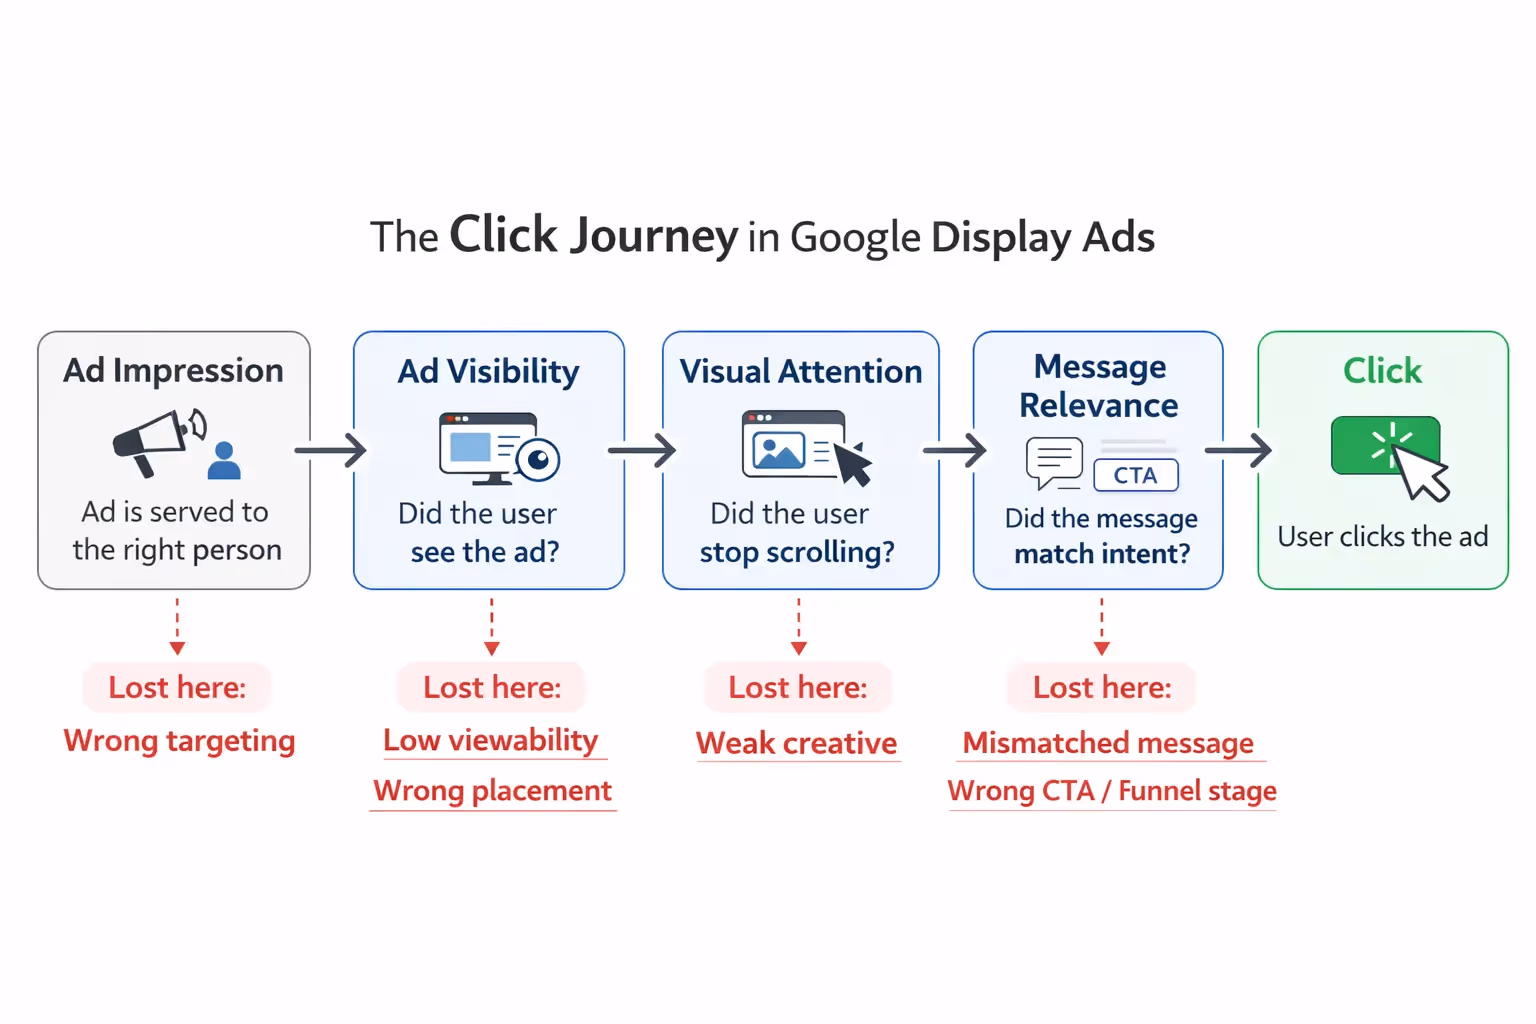
The problem is that the CTR in Display can drop at different stages of the campaign.
For example, the ad was shown, but to an irrelevant audience. Or the audience was right, but the ad didn’t make it into the viewable area, and so on. Each of these points is a separate cause of a low CTR, and each requires a separate solution.
At Aimers, we do more than build marketing campaigns from scratch. We also advise clients on how to optimize campaigns that aren’t delivering the expected results despite already being in progress. Based on our experience, we’ve identified the stages of a display campaign where CTR can drop. Today, we’ll explain how to identify the problem and resolve it. These are not generic ideas, but practical tips to optimizing Display campaigns based on where clicks are actually being lost.
What Is a Good CTR for Google Display Ads – and Why B2B Is Different
CTR in display advertising depends more on the industry than on the quality of a specific campaign. That is why Google Display ads optimization should always start with the right benchmark, not with arbitrary CTR targets. Therefore, before optimizing anything, it is important to understand which baseline figures to use.
First, comparing CTR across different campaign types is rarely useful. The same applies when teams compare Google ads campaign types without accounting for intent and channel mechanics. For instance, the contexts and objectives of Display and Search are fundamentally different. In Search, the user enters a query and receives a response. In Display, the user isn’t interested in the banner; the initiative comes from the advertiser. Therefore, a click in Display requires much more precise alignment between the message and the moment. That is why average Display CTR is 0.46%, versus 6.66% for Search. The channels work differently by design.
In B2B SaaS, the gap from the general benchmark is even more pronounced. Retail and travel companies, for example, work with a broad audience and short decision-making cycles. The user sees a relevant banner and clicks on it. In B2B SaaS, however, a purchase is typically approved by several people, and the deal cycle is measured in weeks. Clicking on a banner while reading an article is rare, even for the target audience. This is a structural feature, not a sign of a poorly optimized campaign. The average Display CTR for B2B SaaS is 0.9%, primarily achieved in remarketing campaigns where the audience is familiar with the product.
However, reaching this benchmark does not guarantee a successful campaign. The same is true for Google ads cost: lower cost metrics do not mean much if the traffic does not convert. A 2% CTR with a low conversion rate is worse than a 0.4% CTR from a hyper-targeted audience that converts better. In 2025, CTR increased in 13 out of 14 industries, but conversion rates fell in all 14. Clicks are becoming cheaper, but they are increasingly unlikely to result in actual action. CTR should be analyzed alongside CR and CPL, not as a standalone metric.
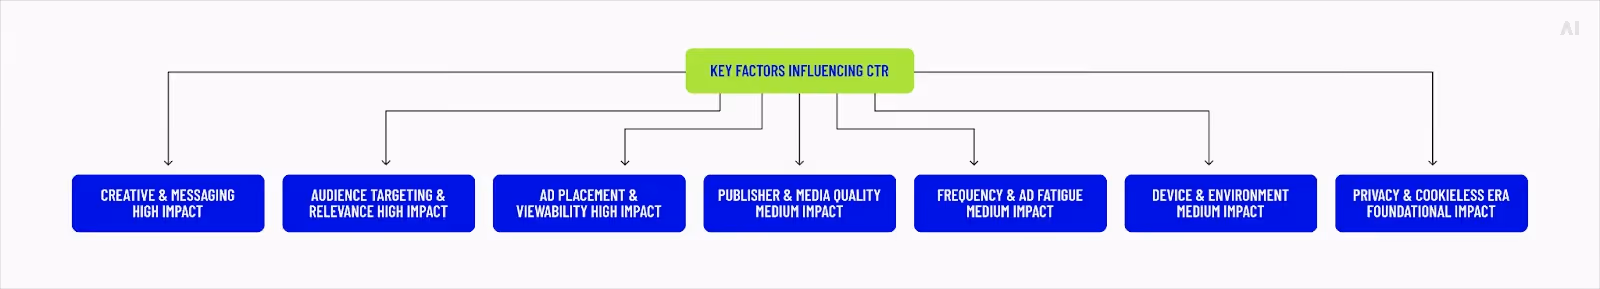
So the goal is not to increase CTR at any cost, but to increase it through relevant clicks. However, as mentioned earlier, we first need to understand where those clicks are being lost. The problem could lie in targeting, placements, creative elements, or messaging. Each case requires a different solution. Display campaign optimization starts with identifying the exact stage where relevance breaks down.
How to Diagnose Where Your CTR Problem Is
Before changing targeting, revising creative, or adjusting bids, you need to identify exactly where the drop happens between impression and click. That is the only reliable way to understand how to improve Display ad performance without wasting budget on random changes.
Each drop-off point leaves a trace in your account data. A high volume of impressions with an abnormally low CTR and normal placements is a different problem than an acceptable CTR with a falling conversion rate on the landing page. Different symptoms require different solutions.
The table below outlines a diagnostic plan for your strategy. You can also treat it as a practical Google ads checklist for diagnosing where CTR is being lost. Find the row that matches what you see in your account, then proceed to the corresponding section of this article.
If no row matches your situation exactly, the problem is likely more complex and affects several areas simultaneously. In that case, we recommend examining each stage in sequence.
Point 1 – Audience Relevance: Reaching the Right Person
Targeting is the first and most costly point where CTR is lost. In many accounts, Google Display ads targeting optimization has a bigger effect on CTR than any creative refresh. You are already paying for impressions, but they are going to users who have no reason to click. They simply don’t need the ad. In the interface, irrelevant reach won’t appear to be a problem: impressions are counted, frequency is rising, and the campaign is running. The problem only becomes apparent when the CTR is consistently low despite normal traffic volume, or when there are clicks but the leads aren’t qualified. This is also the kind of issue PPC audit services should uncover early.
Separate Prospecting and Remarketing at the Campaign Level
First, check your account structure. If your prospecting and remarketing campaigns or ad groups are in the same place, the algorithm receives conflicting signals about who the target user is. Consequently, it optimizes for an average profile that doesn’t match either audience. You should split them into separate campaigns with different budgets and messages. This is a basic step in Google Display campaign optimization because it prevents the algorithm from blending cold and warm signals.
This is crucial for CTR, since the remarketing audience has already interacted with the product and responds to ads differently. Remarketing campaigns in B2B SaaS have a CTR of 1.2%, compared to 0.35% for cold prospecting campaigns. Retargeting generally increases conversion rates by up to 70% compared to a cold audience.
For B2B SaaS, the optimal budget allocation at the start is as follows:
- 30% for prospecting (to build the audience for future cycles)
- 70% for remarketing (to deliver predictable results faster)
Replace Affinity Audiences with Custom Segments in Prospecting
If your prospecting campaigns are running on Affinity Audiences, you should also review them. Affinity Audiences target users with indirect interest in the topic, but not those actively researching the category. Custom segments using competitors' URLs and category-specific keywords yield a higher CTR because they reach an audience with genuine intent. If the goal is to increase Display ad clicks, this is usually a stronger starting point than broad interest-based prospecting. Our baseline recommendation is to:
- Add 5–10 competitor URLs and 15–20 category-specific keywords
- Run in observation mode for two weeks
- After that, keep the segments with a CTR above the campaign average
Use Dynamic Remarketing for Warm Audiences
For B2B SaaS companies with multiple pricing plans or product modules, Dynamic Remarketing shows users the exact plan or feature they’ve already viewed (rather than a generic ad). Dynamic ads achieve a CTR of 1.2% or higher. For companies with a single product, the difference between dynamic and standard remarketing is minimal. In this case, standard remarketing with page-based segmentation delivers comparable results at a lower setup cost.
Turn Off Optimized Targeting on BOFU Campaigns
Optimized Targeting is enabled by default, expanding the audience beyond the specified segments. However, in BOFU campaigns targeting a warm audience, this logic is undermined: the remarketing message begins appearing to a cold audience. That hurts both CTR and Display conversion optimization, because the message is no longer aligned with user intent.
After disabling Optimized Targeting, the number of invalid clicks in one of the documented cases decreased by 84%.
Regularly Exclude Placements with High CTR and Zero Conversions
The Placement Report identifies sites with high CTR and zero downstream conversions – that is, placements that generate clicks from an irrelevant audience. These should be excluded separately from standard placement exclusions. At Aimers, we recommend reviewing the report weekly for the first 30 days of the campaign and biweekly thereafter.
Point 2 – Ad Visibility: Making Sure Your Ad Gets Seen
An impression being counted in the statistics does not mean that the user actually saw the ad. Many weak example Google Display ads fail not because the design is bad, but because the placement never gives them a real chance to be seen. On average, display ads are only 65% viewable: one-third of all paid impressions occur outside the user’s field of view. If the ad is not seen, it cannot get clicked. That makes viewability a direct CTR lever, not just a supporting metric. In other words, Google Display network optimization is not only about targeting, but also about where and how impressions are delivered.
Audit Where Your Ads Are Actually Showing
First, open the "Where Ads Showed" report and sort the placements by impressions. Made-for-advertising sites and mobile games are often the main sources of low viewability. These sites generate a large volume of impressions, but users either don't see the ads or click on them by accident. Both scenarios are equally harmful to CTR.
We recommend excluding placements with a CTR below 0.05% and with more than 1,000 impressions. This is one of the clearest Display advertising optimization steps because it removes inventory that consumes spend without producing useful engagement. Add placements with a CTR above the campaign average to Managed Placements and increase your bids on them.
In practice, niche sites with relevant content often outperform high-traffic, generic platforms in terms of CTR. This is one reason many best Google ads examples in B2B rely on context, not just creative polish. This is because their audience is engaged in a relevant professional context. Such sites include:
- Industry media
- Tech review sites
- Professional forums
Specific placement data confirms the importance of position. Ads above the fold yield a CTR that is 18–30% higher than those displayed below the fold. On news and media sites, viewability reaches 74%, while on forums and community sites, it drops below 55%.
Account for the Mobile vs. Desktop CTR Gap
Although mobile has a 37% higher CTR than desktop (0.52% vs. 0.38%), this is not reason enough for B2B SaaS companies to shift budget in that direction. Demo requests and trial sign-ups still happen predominantly on desktop. A high mobile CTR with a low conversion rate usually signals low-quality clicks, not stronger campaign performance. A high mobile CTR with a low conversion rate indicates irrelevant clicks rather than campaign effectiveness.
Manage Frequency to Prevent Ad Fatigue
Frequency is a direct factor affecting both viewability and CTR. As a simple sample optimization for Display advertising, start by tightening frequency caps before changing bids or rebuilding creatives. Ad fatigue gradually reduces CTR because users stop noticing an ad after seeing it multiple times. The optimal range for TOFU campaigns is 1–3 impressions per week, while the optimal range for remarketing is 7–10 impressions with mandatory creative rotation every 4–6 weeks.
Point 3 – Visual Attention: Stopping the Scroll
If targeting is correct and the ad reaches the right person, the next question is whether the creative can stop the scroll. Any good Google Display ads management agency should be able to separate targeting issues from creative issues at this stage. According to statistics, it takes users 1–3 seconds to notice the banner and decide whether to stop and read it or scroll past. At this point, they haven’t read the headline and don't fully grasp the message yet. If the ad isn't engaging, all the effort put into targeting won't result in a click. Creative quality influences CTR just as much as targeting precision. That is why Google Display ads creative optimization should be treated as a core performance lever, not a design task. Here are the main levers that improve CTR at this stage.
Format: Video and Motion Outperform Static
According to the latest benchmarks, video display ads generate an 89% higher CTR compared to static image ads. Motion banners – a hybrid between static and video ads–deliver comparable results at a lower production cost. In one case study, a B2B company increased its CTR by 43% by switching from static to motion banners featuring a stronger value proposition. For many teams, this is where Display ad optimization starts producing visible CTR gains.
Responsive vs. Static: Choose Based on Funnel Stage
Responsive Display Ads (RDAs) are the default format in Google Ads. Advertisers who use multiple asset variations simultaneously see an average increase of 10% in conversions because the algorithm selects the optimal combination for each ad placement. RDAs are ideal for prospecting because they offer maximum placement coverage and allow for rapid asset testing through asset-level reporting.
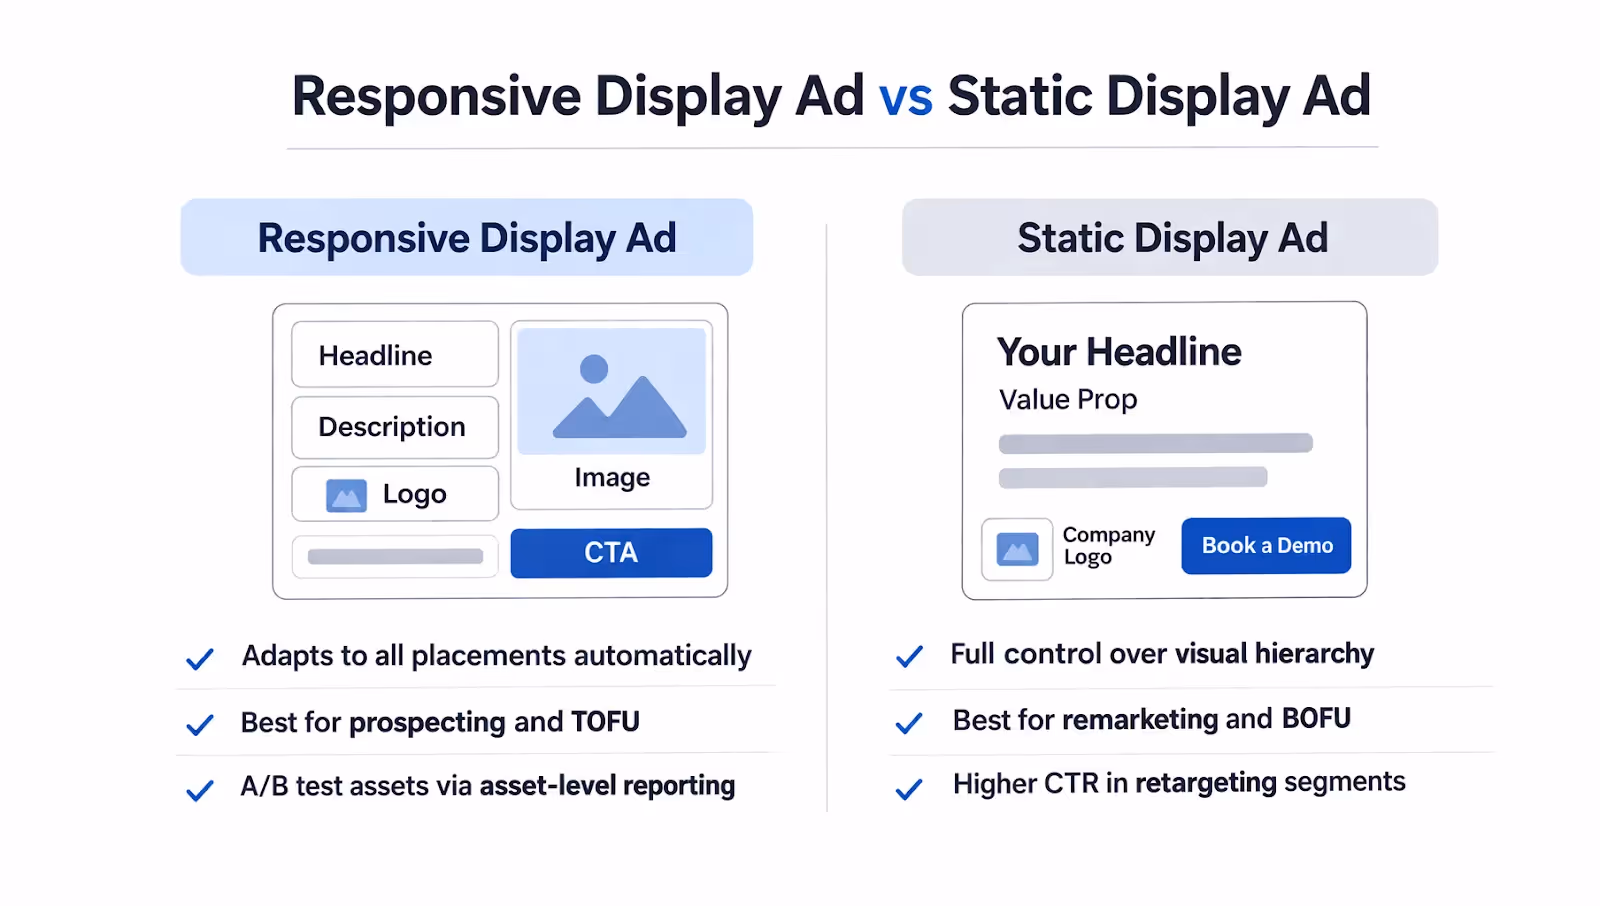
In A/B testing, static ads have a higher click-through rate (CTR) in remarketing segments. Full control over the visual hierarchy enables more precise tailoring of your message to a specific audience. You can start by using RDAs for prospecting and static ads for remarketing. This kind of format split is standard for a SaaS digital marketing agency working across funnel stages.
Asset-Level Reporting: How to Identify Weak Spots in RDAs
In Google Ads, each RDA asset receives a rating: Low, Good, or Best. Low-rated assets lower the campaign’s overall CTR, so they should be replaced rather than left in the rotation. In our campaigns, we typically run 3–5 headlines and 2–3 descriptions simultaneously while regularly removing low-rated assets and adding new variations for testing.
Creative Fatigue: When to Refresh
Even high-performing creatives eventually stop delivering results. Due to frequent impressions, the audience eventually stops responding. In the data, this looks like this: The CTR drops, but the number of impressions remains the same. The algorithm continues to run the ad within the allocated budget, but people no longer notice it.
The main signal to refresh is a CTR drop of more than 25% from the campaign's initial level. Don't wait for it to drop further. In Display, the audience becomes saturated more slowly than in other channels because impressions are spread across a wide network. Therefore, updating creatives every 28–35 days is sufficient. For campaigns with over one million impressions per month, proactively updating static creatives every four to six weeks makes sense. At these volumes, ad fatigue sets in faster than it can be detected in the data. For B2B SaaS with a narrow audience, this timeframe is shorter; the smaller the audience, the faster each user accumulates impressions. With an audience of fewer than 50,000 users, it's worth checking for signals weekly.
Point 4 – Message Relevance: Converting Attention into a Click
Even if a user stops to look at an ad, that doesn’t mean they’ll click on it. For a click to happen, the ad must offer a specific solution to a specific group of people. If the ad shows the wrong offer, CTA, or promise for that audience at that stage of the funnel, the user will leave. Even when targeting, placements, and creative are already set up correctly, message relevance is the final filter where clicks are lost. This is also where a conversion rate optimization agency can help align ad promise and landing page intent more tightly.
Current data confirms this issue. In 2025, CTR increased across all 14 industries (+7.49%), but CR fell in 13 out of 14. This means that ads are getting better at attracting clicks, but worse at converting them into action.
Match the Message to the Funnel Stage
The same ad won't be as effective for cold and warm audiences. A user at the top of the funnel (TOFU) is seeing the ad for the first time. An aggressive CTA, such as "Book a Demo," will seem like pressure rather than an invitation. A user from the remarketing list has already visited the pricing page, so a soft CTA like "Learn More" won't motivate them to return. This follows directly from the CTR vs. CR data above.
Here are a few examples of effective CTAs for different funnel stages:
- "Learn More" and "See How It Works" for TOFU
- "Watch a Demo" and "Start Free Trial" for MOFU
- "Book a Demo" and "Get a Quote" for BOFU
Specific Value Proposition Over Generic Messaging
Ads with measurable, specific benefits ("Save 3 Hours Daily," "Reduce Onboarding Time by 40%") outperform generic brand messaging by 200–300%. In B2B SaaS, a concrete appeal such as "Close Projects 2x Faster – See How" works better than the abstract "The Best Project Management Software." Users can apply this specific result to their own situation, resulting in better conversion rates.
CTA Wording Has a Direct Impact on CTR
The CTA is the last thing a user sees before deciding to click or leave. However, most display ads use the same CTA for everyone, whether they are seeing the ad for the first time or have already visited the pricing page. The wording matters a great deal.
Action verbs ("Get," "Save," "See," "Start") increase CTR by 20% or more compared to passive phrasing. If the goal is to improve CTR Google Display ads, CTA wording is one of the fastest variables to test. Personalized CTAs tailored to specific audience segments outperform static ones by 20% or more. For B2B SaaS, the minimum level of personalization is using different CTAs for cold and remarketing audiences within a single campaign.
Quality Score as a Relevance Indicator
In Google Ads, Quality Score reflects ad relevance, expected engagement, and landing page alignment. It is measured on a scale of 1 to 10, with 10 indicating the highest relevance. Ads with a QS of 8–10 achieve a CTR that is 92% higher in the top position than ads with a low QS.
For Display, QS is less critical than for Search. Since there are no keywords to target users, the algorithm evaluates relevance differently. However, the principle remains the same: if an ad promises one thing and the landing page shows another, users won't engage with it. This can explain situations where CTR rises while CR falls. The click happened because the headline caught the user’s attention. However, there is no conversion because the landing page does not continue what the ad started (it offers something different, uses a different tone or has a different CTA).
We recommend reviewing the landing page as if you were a user who had just clicked on the banner. Check whether it delivers on the promise of the ad headline, or if it starts the conversation all over again.
CTR Optimization Checklist for Google Display Ads
As CTR in display advertising depends on the structure of the entire process from impression to click, we have put together a checklist to help you audit your campaign. Think of it as a practical set of Display advertising tips tied to the real stages where clicks are lost. It will help you identify where clicks are being lost in your campaign.
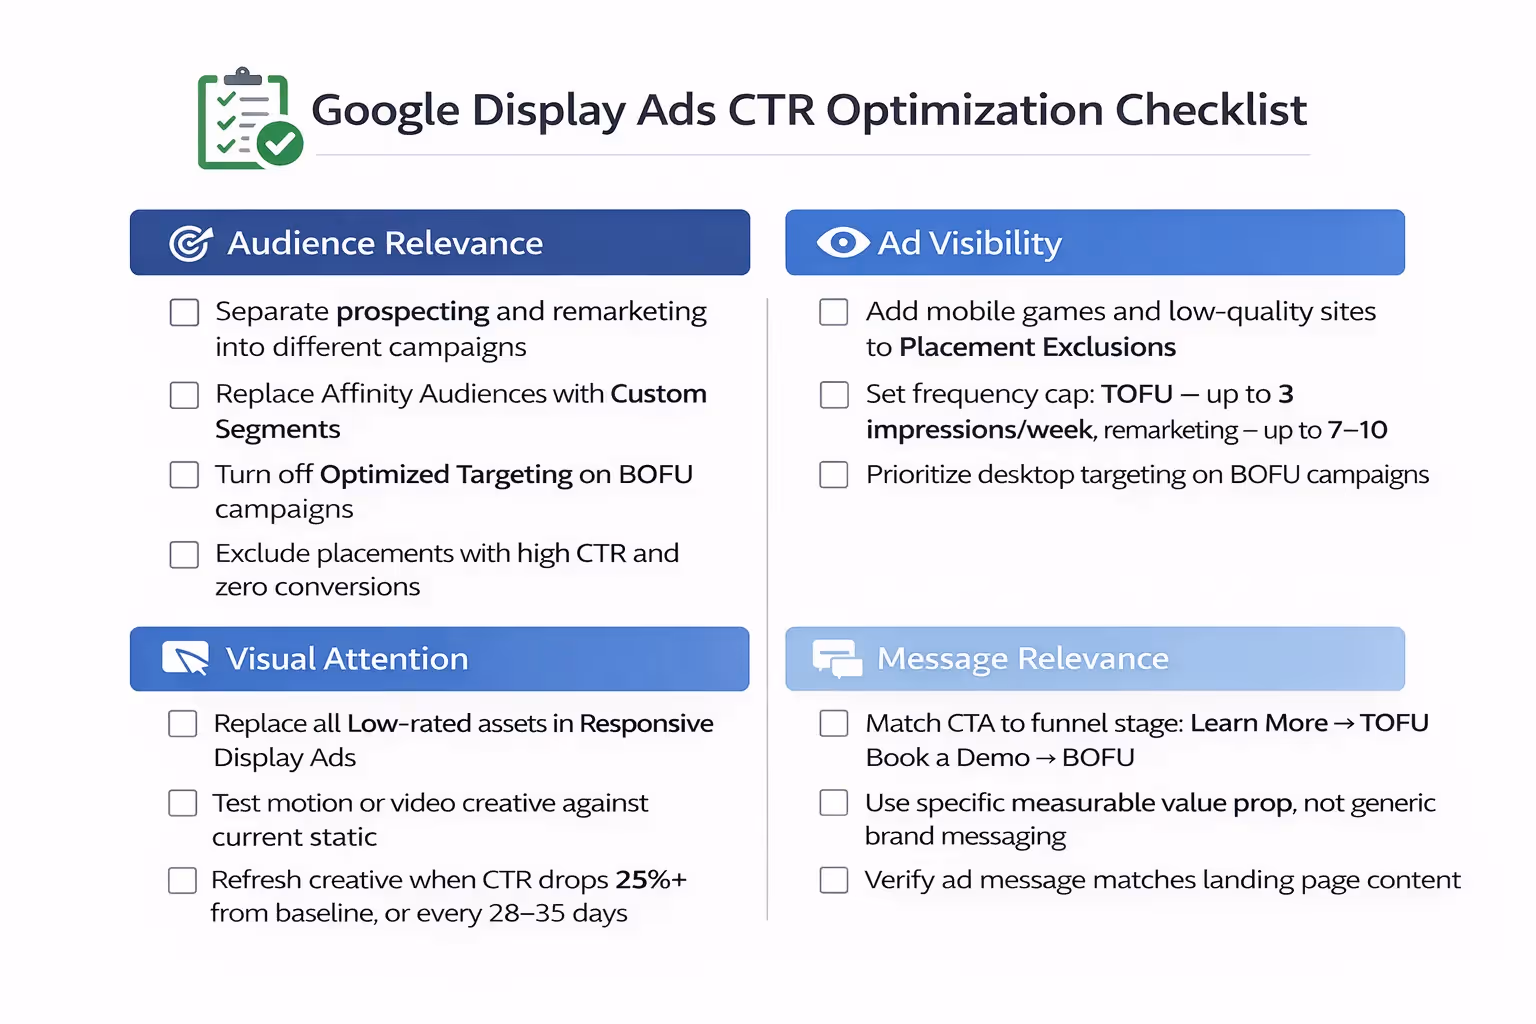
If you need a deeper audit or want to build a Display strategy from scratch, you can book a free consultation with our team.
Key Takeaways
CTR in Display cannot be improved with a single fix. It can break at different points in the funnel, so the first step is always to identify where clicks are being lost: targeting, visibility, creative, or message relevance. In B2B SaaS, the goal is not to maximize CTR at any cost, but to increase the share of relevant clicks.
In practice, the strongest gains usually come from a few core decisions. Prospecting and remarketing should be separated. Broad audience layers should be replaced with more precise segments. Optimized Targeting in BOFU often does more harm than good. Placements should be reviewed regularly, and creatives should be refreshed before fatigue sets in.
Most importantly, a strong CTR does not guarantee a strong campaign. Performance should be evaluated through CTR, CR, and CPL together. That is the only reliable way to understand whether clicks are translating into real business value.
FAQs
Why Is CTR in Google Display Ads Usually Lower Than in Search?
What Is a Good CTR for Google Display Ads in B2B SaaS?
Why Can CTR Drop at Different Stages of a Display Campaign?
What Should Be Checked First When Display CTR Is Low?
Why Is Audience Relevance So Important for CTR?

February 24, 2025