LinkedIn Ads Benchmarks for B2B SaaS: CTR, CPC, CPL

April 20, 2026

As with any other PPC channel, LinkedIn Ads require continuous performance evaluation. At Aimers, we frequently collaborate with B2B SaaS companies on existing LinkedIn Ads campaigns. Our first step is always to audit the current metrics. However, you don't always need to consult experts to identify the weak points in your LinkedIn Ads strategy. You can start by comparing your numbers to current benchmarks. This is where LinkedIn ad benchmarks become a practical reference point rather than a generic market snapshot. We’ve analyzed the latest reports on key metrics and outlined how to use them to improve your LinkedIn marketing performance.
Why LinkedIn Ad Metrics Look Different for B2B SaaS
Evaluating performance data might seem simple: gather it, compare it, and identify where it differs from your own. However, it’s not that simple. Most public LinkedIn Ads benchmarks are averages across all industries. However, broad LinkedIn ads benchmarks are largely irrelevant for SaaS because it is one of the most competitive categories on the platform. This needs to be accounted for when evaluating performance.
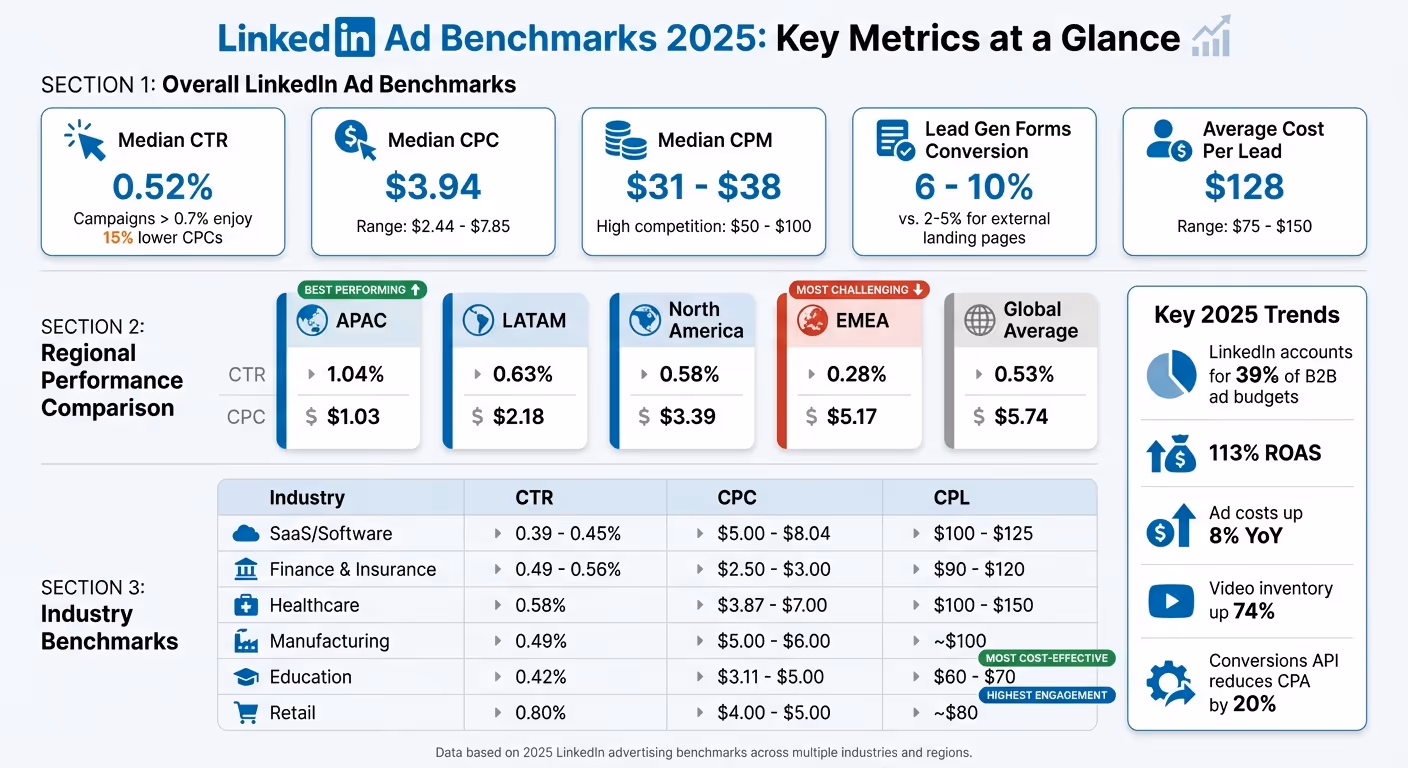
For example, one open-source report states that the median CPC for SaaS is $8.04, compared to $2.59 for finance and less than $3 for education. This is driven by one key factor: dozens of SaaS companies target the same CTOs, VPs, and directors. When many advertisers compete for the same audience, the platform’s auction system drives up prices. This is one of the main reasons why LinkedIn ads costs vary so sharply by category and audience seniority. This is an inherent characteristic of the SaaS segment on LinkedIn.
The second factor that changes how the numbers are interpreted is ACV (average contract value). For instance, a $3 cost per click (CPC) might be standard for a self-serve task management SaaS offering with an $8/month plan, but it would be an absurd benchmark for an enterprise platform with an ACV of $180,000. The same applies to CPL. For a low-cost, self-serve product, a few dollars per lead can be a viable model. For an enterprise solution, however, the figure could run into the thousands, and this is expected. Therefore, when evaluating benchmarks, keep the specific sales cycles and economics of each product in mind.
For example, a client was spending $21,000 per month on LinkedIn at a CPL of $778 and believed the platform wasn’t working. In reality, 94% of the budget was going to the wrong audience: junior developers without purchasing authority, agency employees, and companies of the wrong size. After revising the targeting, the CPC increased from $8.50 to $12, but the CPL decreased to $412 because clicks started coming from people who make purchasing decisions.
CTR Benchmarks: What's Normal and What's a Signal
Most marketers first look at CTR. In most cases, they are trying to understand the average LinkedIn ad click through rate before diving into deeper performance analysis. On LinkedIn, however, this metric doesn’t reflect interest in the product or purchase intent; rather, it reflects how well the ad captured the attention of a specific audience. A high CTR with poor targeting indicates expensive traffic from an irrelevant audience. Conversely, a low CTR with precise targeting may be normal for a narrow, senior audience that clicks less frequently but converts better. With that in mind, let’s look at the current benchmarks.
The median CTR for LinkedIn Sponsored Content is between 0.44% and 0.65%, with a market median of 0.52%. Top performers reach over 0.7%.
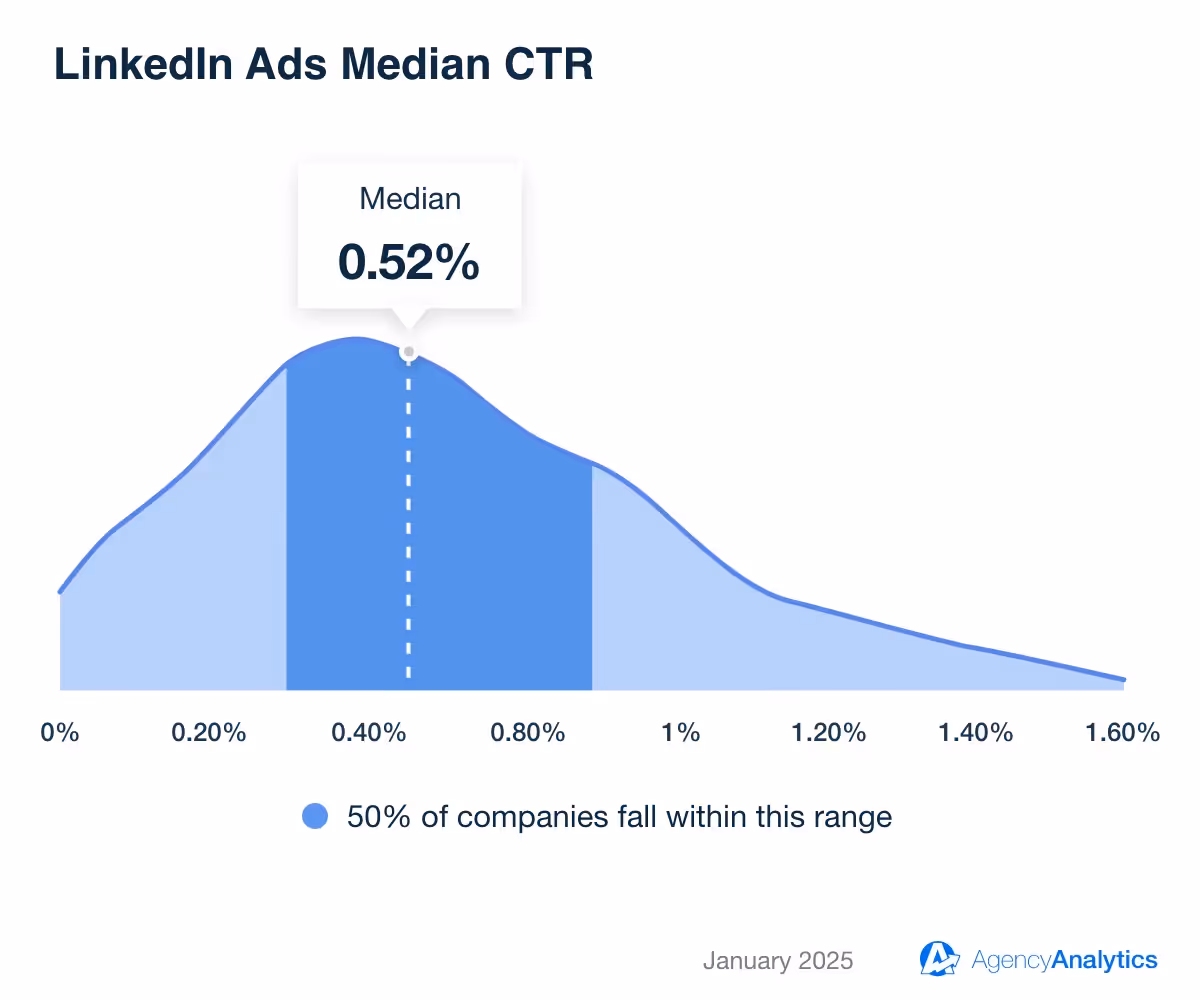
For SaaS and tech feed formats specifically, a realistic range is 0.50–0.65%. In other words, the average CTR LinkedIn ads deliver in SaaS usually sits above the all-industry baseline when targeting and creative are aligned. The top quartile regularly reaches 0.80–1.00% or higher. These figures are based on 213 million impressions from 1,240 SaaS and tech campaigns. If your CTR is consistently below 0.45% despite correct targeting, it's time to review your ad headline or the fit between your audience and your message. If your CTR drops while your targeting remains unchanged, audience fatigue is almost always the cause, not a platform issue. We recommend that SaaS companies with narrow audiences rotate creatives every 14 days.
How Ad Formats Affect CTR
Another detail that’s easy to overlook is ad formats. Any LinkedIn ads CTR benchmark needs to be read within the context of format, because Document Ads, Thought Leader Ads, and Conversation Ads are measured differently. Since each format has its own interaction dynamics, direct CTR comparison across formats is misleading.
Thought Leader Ads deserve a special mention. These are native posts from employees amplified with paid budget. They resemble regular feed posts rather than ads, which is precisely why they perform better. In an experiment, the CTR was 2.5 times higher than the benchmark, and the CPC was $18.40 lower than standard formats.This remains one of the most underrated formats for SaaS companies with active experts or founders who have an audience.
Audience Seniority and Seasonality
Senior decision-makers (VP, Director, and above) have a CTR of approximately 0.55%, which is slightly above the median. For teams asking what is a good CTR for LinkedIn ads, the answer depends on audience seniority, format, and funnel stage. At first glance, this may seem counterintuitive, as the prevailing view is that busy executives click less frequently. However, the platform’s professional context and the relevance of the offer to decision-makers offsets this.
As for seasonality, Q3 is the best quarter for CTR (0.96%), while Q1 is the worst (0.82%), despite the fact that companies typically spend more at the beginning of the year. In Q3, teams are actively planning for the next period and are more receptive to professional content. In Q1, budgets are available, but the audience becomes more active after the holidays. For SaaS, this means that Q1 is cheaper in terms of CPC but requires stronger creative to achieve the same CTR.
CPC Benchmarks: What You're Paying Per Click in B2B SaaS
CPC is determined through an auction. That is why the average CPC on LinkedIn is never a fixed platform number and always reflects competition, targeting, and ad quality. You set a maximum bid, and LinkedIn determines the actual cost based on the competition for your target audience and the quality of your ad. In other words, CPC depends on both how much you’re willing to pay and how well your ad is crafted.
SaaS Benchmarks by Region
In North America, the CPC for SaaS sponsored content ranges from $8 to $12. For C-suite targeting, the CPC is $15 or more. For many B2B teams, this is the most realistic reference for average CPC LinkedIn ads in competitive SaaS categories.
In EMEA, the CPC for similar targeting is €4–5, which is 2–3 times lower than in North America. Meanwhile, CTR is declining in mature EMEA markets (the UK, Germany, and France), as more advertisers compete for the same audience, putting pressure on organic engagement.
Running campaigns across regions without budget separation will distort aggregated metrics with fundamentally different price levels, making them difficult to interpret.
CPC by Format
This breakdown is the most practical way to interpret any LinkedIn ads CPC benchmark, since pricing varies significantly by format.
Three Factors That Really Drive CPC in SaaS
The first factor is audience size. For marketers wondering what is a good CPC on LinkedIn ads, the answer starts with how narrow the auction pool is. If the audience is below 50,000, there are too few available impressions. Ads compete in a smaller auction pool, which increases competition for user attention and raises CPC. The optimal audience size for most SaaS campaigns is 30,000–100,000. Our experience shows that this size is sufficient for the algorithm to optimize delivery while remaining narrow enough to ensure relevance.
Second is ad relevance score. LinkedIn calculates the quality of each ad based on CTR, engagement, and conversion signals. Higher-quality ads increase your chances of winning auctions against competitors with higher bids. In practice, using the right hook and a message that precisely matches the audience can reduce CPC by 20–40% at the same bid. Therefore, creative rotation is also a direct lever for managing cost.
Third is seasonality. CPC peaks in Q3 ($15.72 on average for B2B SaaS) and hits a low in Q1 ($10.48), with a difference of 1.5x. If your budget is limited, launching in Q1 allows you to acquire more clicks for the same amount of money. However, you need to account for a lower CTR during this period.
Overall, CPCs for B2B tech companies have increased by 8% year over year. LinkedIn is becoming more expensive as more B2B budgets shift to the platform.
Why a High CPC Isn’t Always a Problem
For one of our clients in the analytical SaaS sector, LinkedIn had a CPC of $11.20, compared to $4.50 for Google. At first glance, Google appears to be 2.5 times more cost-effective. But LinkedIn leads converted into customers at a 12% rate, compared to 4% on Google. The final CAC on LinkedIn turned out to be lower, despite a CPC that was three times higher. This is exactly where conversion rate optimization solutions become more important than top-line click cost alone.
CPL Benchmarks: From Lead Form to Qualified Lead
CPL is a key metric for most SaaS teams. A useful LinkedIn ads CPL benchmark only makes sense once the offer type and buying intent are clearly defined. However, before comparing it to benchmarks, it’s important to define what constitutes a lead. Examples include a completed lead generation form, a demo request, a report download, or a webinar registration. While all of these technically fall under the definition of a “lead,” they have different costs and values for the pipeline.
CPL by Offer Type
This variation is driven by friction and intent. Since downloading a report has a low barrier to entry, the CPL is lower; however, the intent to purchase is also lower. Requesting a demo has a high barrier to entry, so the CPL is higher; however, this indicates genuine commercial interest. This is why comparing CPL across different offer types is misleading.
CPL by SaaS Segment
CPL in SaaS varies depending on the campaign, based on targeting and offer type. The economics are fundamentally different between a startup targeting a broad tech audience with an offer to download a guide and an enterprise company seeking a demo from a CTO in fintech.
The median CPL for the software and IT sector is $125, based on data from $1 million in ad spending. While this is a good benchmark for the mid-market, it does not take into account the type of offer or geographic region.
TOFU vs. Retargeting: The Difference in CPL
The CPL for a cold TOFU audience averages around $180. In contrast, retargeting campaigns yield a CPL of ~$90 and a 400% ROI. The reason is straightforward: A user who has visited your site or engaged with your content is closer to making a purchase. Highly matched audiences of 1,000–10,000 contacts can reduce the CPL by 30–50%, compared to broader targeting. Therefore, for SaaS companies with long sales cycles, retargeting is an essential part of the media mix, especially when paired with broader reach tactics such as the LinkedIn audience network.
Why Choosing a CTA Affects CPL
The CTA is one of the most underrated levers, based on over 50,000 LinkedIn experiments.
"Download" is the most effective because it offers immediate, tangible value without making users feel as if they are about to be redirected to a cold call.
"Sign up" is the worst option because, in a professional context on LinkedIn, it's perceived as a commercial commitment.
Before adjusting targeting or budget due to high CPL, review your CTA. Switching from "Sign Up" to "Download" with the same offer can reduce CPL several times over.
Beyond CTR and CPL: Funnel Metrics That Actually Matter
CTR and CPL are convenient metrics because they’re immediately visible in Campaign Manager. However, for B2B SaaS companies with a 3–6 month sales cycle, these metrics do not reflect the full picture. A lead generated today may not convert into a customer for six months, so if you evaluate LinkedIn solely based on in-platform metrics, you will systematically underestimate LinkedIn’s contribution.
The Actual Length of the B2B SaaS Journey
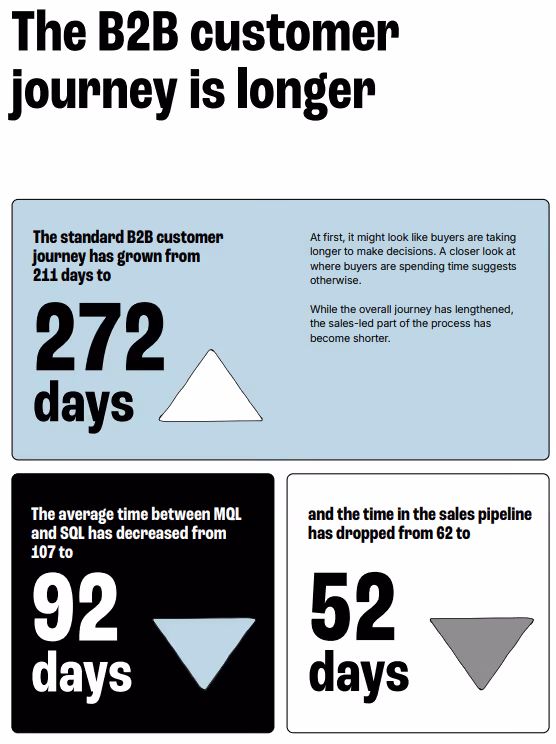
According to Dreamdata, the average B2B customer journey lasts 211 days. This context is critical when interpreting LinkedIn advertising benchmarks, especially for long sales cycles. For large companies, it is 49% longer. The transition from MQL to SQL takes the longest at more than three months.
On LinkedIn, the average time from first impression to conversion is 320 days and from the first engagement to conversion is 235 days. Companies that measure ROAS over a 30-day attribution window tend to underestimate LinkedIn's overall contribution because most deals do not close within that timeframe.
ROAS and Cost Per Company
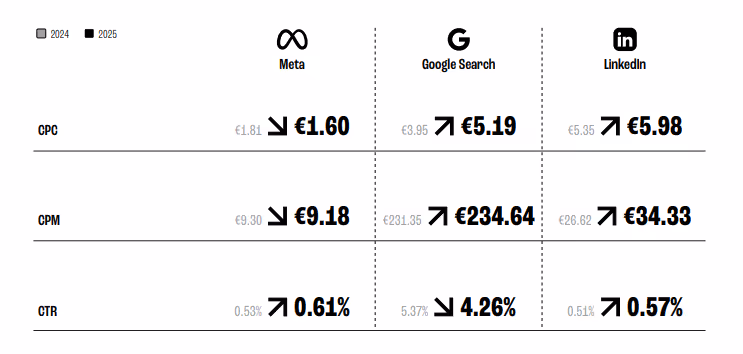
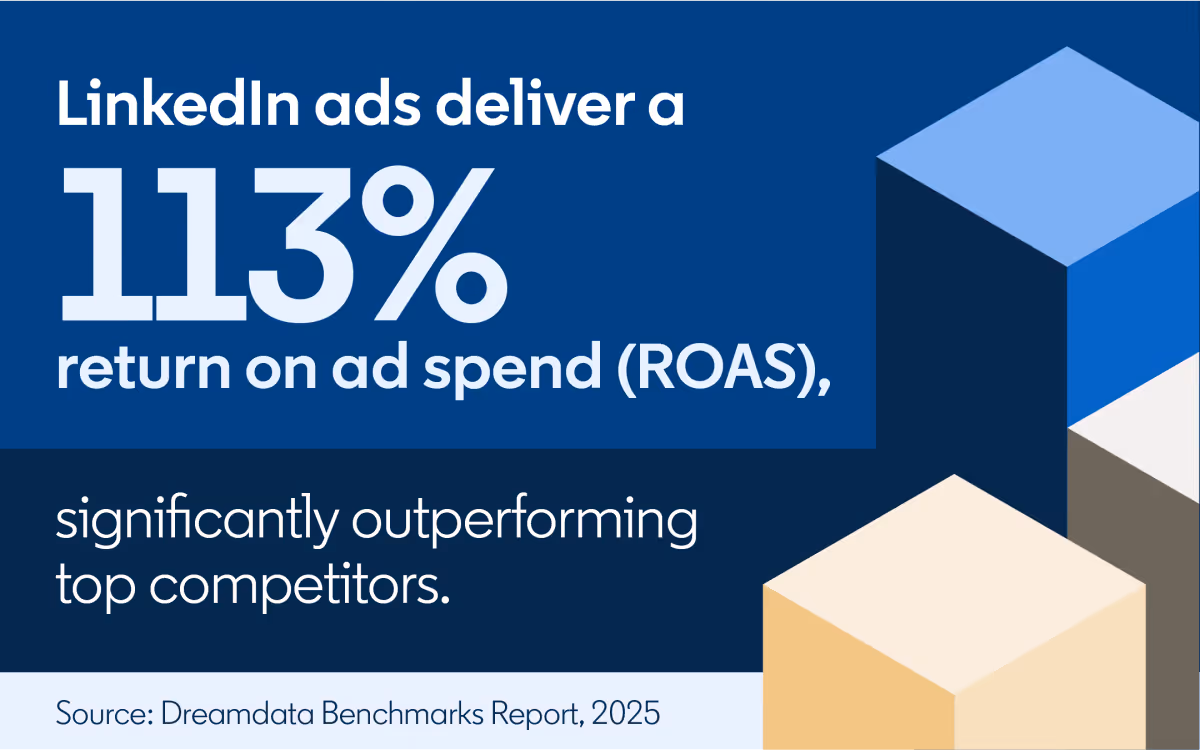
LinkedIn's ROAS is 113%, which is higher than Google Search (78%) and Meta (29%). This is where LinkedIn ad performance benchmarks shift from click-level metrics to revenue impact. At the same time, the cost per influenced company is 25% lower than with Google Search and 70% lower than with Meta. This means that, despite a higher CPC at the click level, reaching a single target company via LinkedIn is cheaper than through other channels. The reason lies in targeting accuracy: fewer irrelevant impressions and a higher share of hits within the ideal customer profile (ICP). That is also why raw cost per impression LinkedIn metrics should never be evaluated without audience quality.
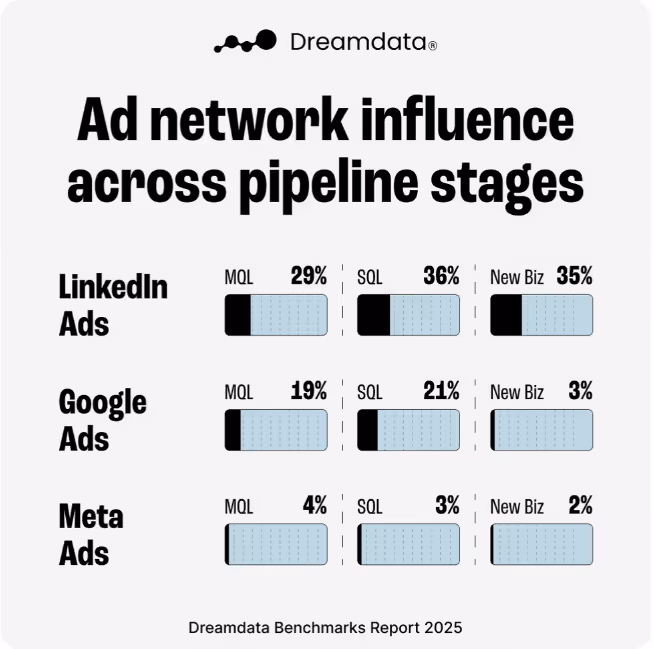
LinkedIn influences all stages of the funnel: 29% of MQLs, 36% of SQLs, and 35% of new business deals had at least one touchpoint with LinkedIn ads, which is more than Google or Meta at each stage.
CAPI: Why Attribution Is Unreliable Without It
The LinkedIn Conversions API (CAPI) transmits conversion data directly from the server, bypassing browser restrictions such as ad blockers and cookie limitations. This is particularly important in B2B SaaS. For example, if a conversion is a demo request and the deal isn’t closed for another six months, every lost conversion signal will distort the algorithm’s training and reduce the effectiveness of optimization. According to LinkedIn, CAPI users have a 20% lower CPA and 31% more attributed conversions than those who use only the LinkedIn Pixel. Without CAPI, the platform literally doesn’t know which ads lead to deals. This is one of the first infrastructure issues a strong LinkedIn ads agency should audit in B2B SaaS accounts.
For one of our clients in the compliance SaaS niche, Google Ads delivered an ROI of 1.8:1, while LinkedIn delivered an ROI of 4:1. LinkedIn accounted for 40% of the total pipeline in the first year. This is because people don't search for compliance software until they have a problem. LinkedIn allowed us to proactively reach them through job title and industry targeting without waiting for them to start looking for a solution on their own.
What Affects Your Benchmarks: Five Variables to Check First
If your metrics differ significantly from the provided benchmarks, you should systematically check these five variables before switching platforms or cutting your budget. Only after that does it make sense to compare support options such as a List of LinkedIn ads agencies.
1. Audience size
Audiences smaller than 50,000 create an artificial inventory shortage. When there are few impressions and several advertisers, the auction drives cost per click (CPC) up, even for good ads. The optimal audience size for B2B SaaS is 30,000–100,000. Below this range, there is a shortage of inventory and rising CPC. Above this range, relevance decreases, and the share of non-targeted impressions increases.
2. Ad Relevance Score
The Ad Relevance Score is an internal metric that LinkedIn uses to evaluate ad quality. It is calculated based on CTR, engagement, and conversion signals. Although it is not directly visible in Campaign Manager, it influences the auction. High ad quality enables you to win auctions with a lower bid. The difference in CPC can be 20–40% with the same bid. Leverage points:
- Rotate creatives every 14 days.
- Ensure the ad’s hook precisely addresses the pain points of a specific audience.
3. Ad format relative to the funnel stage
Common mistakes that drive up CPL for no apparent reason include running Conversation Ads on a cold audience or promoting content through a format optimized for conversion. Practical guidelines for SaaS:
- Thought Leader Ads and Single Image for TOFU
- Document Ads + Lead Gen Form for MOFU
- Conversation Ads for ABM BOFU targeting a narrow list of accounts
4. Geography
If a campaign targets multiple regions simultaneously without separating budgets, the aggregated metrics will mix fundamentally different price levels. Segmentation by region is essential for accurate data interpretation.
5. CTA Selection
Although the CTA is one of the fastest ways to reduce CPL, it is often overlooked by marketers. Reviewing real LinkedIn ads examples makes this easier because the link between CTA wording and conversion intent becomes much more obvious. "Download" yields the highest CTR and lowest CPL ($125.71), while "Sign Up" yields the lowest CTR and highest CPL. If you’re using "Sign Up" for lead generation on LinkedIn, switching to "Download" with the same offer can reduce CPL several times over without making any other changes to the campaign.
Work With Aimers on LinkedIn Ads
At Aimers, we help B2B SaaS teams turn benchmark data into practical decisions and stronger pipeline outcomes. We do not treat CTR, CPC, and CPL as isolated metrics. We look at how targeting, creative, bidding, funnel stage, and attribution work together, because that is what determines whether LinkedIn becomes an efficient growth channel.
If your LinkedIn campaigns are already live but the results are inconsistent, we can help identify what is holding performance back and where the real optimization opportunities are. As digital marketing experts for SaaS, we focus on the changes that improve lead quality, conversion efficiency, and revenue impact, not just surface-level platform metrics.
FAQs
What is a good click-through rate (CTR) for LinkedIn ads?
What is the average CPC on LinkedIn?
What is a good cost per lead (CPL) on LinkedIn?
Why are LinkedIn ads so expensive?
How can you optimize the performance of your LinkedIn ads?

February 24, 2025