
SaaS Google Ads Benchmarks 2026: CPC, CPL, and Cost Drivers

SaaS Google Ads benchmarks are easy to quote and surprisingly easy to misuse.
One report puts non-brand B2B SaaS CPC around $5.34. Another places median non-brand SaaS Search CPC between $8.50 and $14.00. In cybersecurity, the average can sit closer to $18. In DevTools, it can be less than half of that.
So, what is the real SaaS Google Ads benchmark for 2026?
The honest answer: it depends on your vertical, ACV, sales cycle, geography, brand demand, and how cleanly your CRM data feeds back into Google Ads. A $350 CPL can be a serious warning sign for a low-ACV SaaS product and completely reasonable for an enterprise SaaS company if it turns into qualified pipeline.
This guide gives you a practical benchmark view for SaaS Google Ads in 2026, including CPC, CTR, conversion rate, CPL, and cost per SQL. It also explains why benchmark reports disagree, how to read the numbers correctly, and what actually drives costs up or down in real SaaS accounts.
Quick Takeaways
- In 2026, healthy non-brand SaaS Search CPC often sits between $5 and $14, but competitive verticals such as cybersecurity, fintech, and healthcare can go much higher
- GrowthSpree’s 2026 SaaS benchmark report, based on $60M+ in managed ad spend across 300+ B2B SaaS accounts, puts median non-brand Search CPC at $8.50-$14.00. Involve Digital cites a lower non-branded B2B SaaS CPC average of $5.34, while also noting that CPC is up 29% year over year
- For SaaS, cost per SQL is usually more useful than CPL. A cheap lead that never becomes sales-qualified is not actually cheap
- ACV changes the meaning of “expensive.” A $1,500 SQL can be unsustainable for a low-ACV SaaS product and completely reasonable for an enterprise SaaS company with strong close rates and retention
- The biggest cost drivers in 2026 are category competition, messy search intent, weak landing page relevance, poor campaign segmentation, and missing offline conversion data
- The best-performing SaaS accounts do not just lower bids. They separate brand from acquisition, match landing pages to intent, import CRM-stage conversions, and optimize toward pipeline quality
SaaS Google Ads Benchmarks for 2026
Use these benchmarks as a diagnostic starting point, not as a fixed pass-or-fail score. Your actual target should be tied to ACV, close rate, payback period, and pipeline quality.
The ranges below are based on GrowthSpree’s 2026 SaaS Google Ads benchmark data, which comes from $60M+ in managed ad spend across 300+ B2B SaaS accounts. GrowthSpree reports aggregate performance by median, top quartile, and bottom quartile. For this guide, we translate those ranges into strong, typical, and weak performance so SaaS teams can use the table as a practical diagnostic tool.
Read the table in layers, not as a single scorecard. A strong CPC does not help much if the traffic never becomes sales-qualified. A high CPL may still work if the SQL rate, opportunity rate, and ACV support the economics. The most important line in this table is not CPC. It is cost per SQL. CPC tells you how expensive the auction is. CPL tells you whether your landing page and offer can convert traffic. Cost per SQL tells you whether Google Ads is creating demand that sales can actually work.
That distinction matters because many SaaS accounts look healthy at the lead level and weak at the pipeline level. If Google is optimizing for content downloads, free tools, or low-intent form fills, CPL can improve while revenue quality gets worse.
Where These Numbers Come From
Benchmark content gets thin when it gives numbers without context. The benchmark table above is based on GrowthSpree’s 2026 SaaS Google Ads benchmark data, which analyzes $60M+ in managed ad spend across 300+ B2B SaaS accounts and segments performance by vertical, ACV range, and sales cycle length.
But benchmark ranges are only one part of the picture. To understand why SaaS Google Ads costs rise or fall, we also use sources that explain campaign structure, conversion quality, auction relevance, automation, and offline conversion feedback.
- GrowthSpree SaaS Google Ads Benchmarks 2026
Adds CPC, CTR, CVR, CPL, cost-per-SQL, vertical and ACV benchmarks. Best source for SaaS-specific benchmark ranges. - Involve Digital Google Ads for B2B SaaS:
Adds non-brand CPC trend, campaign structure, and offline conversion guidance. Useful for interpreting rising CPCs and CRM-based bidding. - HockeyStack State of Google Ads:
Adds data from 198 B2B SaaS companies and $150M+ in spend. Useful for looking beyond CPL into qualified and closed-won influence. - Google Quality Score documentation
Official explanation of Quality Score components. Useful for diagnosing CPC and relevance issues. - Google offline conversion imports
Official guidance on importing offline lead and sales data. Essential for SaaS teams optimizing beyond form fills. - Google Performance Max documentation and Smart Bidding documentation:
Official guidance on automation and bidding. Useful for deciding when AI-driven bidding can scale and when it can waste budget.
These sources do not always agree because they are not measuring the same thing. Some benchmark blended B2B SaaS. Some isolate non-brand Search. Some focus on wasted spend, pipeline influence, or closed-won impact instead of front-end metrics. That is not a problem if you read the numbers correctly.
The safest approach is to benchmark in layers:
- Compare CPC, CTR, and CVR against your SaaS vertical and campaign type.
- Compare CPL against offer type, landing page intent, and conversion quality.
- Compare cost per SQL and cost per opportunity against ACV.
- Compare pipeline and closed-won revenue against payback targets.
SaaS Google Ads Benchmarks by Vertical
Vertical is one of the biggest reasons SaaS Google Ads benchmarks vary so much. A DevTools company and a cybersecurity company are not buying the same auction, even if both are "B2B SaaS."
GrowthSpree’s 2026 SaaS Google Ads benchmark data shows how sharply CPC, CTR, conversion rate, CPL, and cost per SQL can vary by SaaS category. The table below uses those vertical-level benchmarks as a diagnostic reference, not as a universal target.
This is why one universal SaaS CPC average can be misleading.
If you sell cybersecurity software, an $18 CPC may be normal. If you sell project management software, the same CPC may indicate weak Quality Score, overbroad targeting, or an overly competitive keyword set. If you sell DevTools, a lower CPC does not automatically mean the channel is efficient. Developers often research deeply before buying, so the SQL rate still matters.
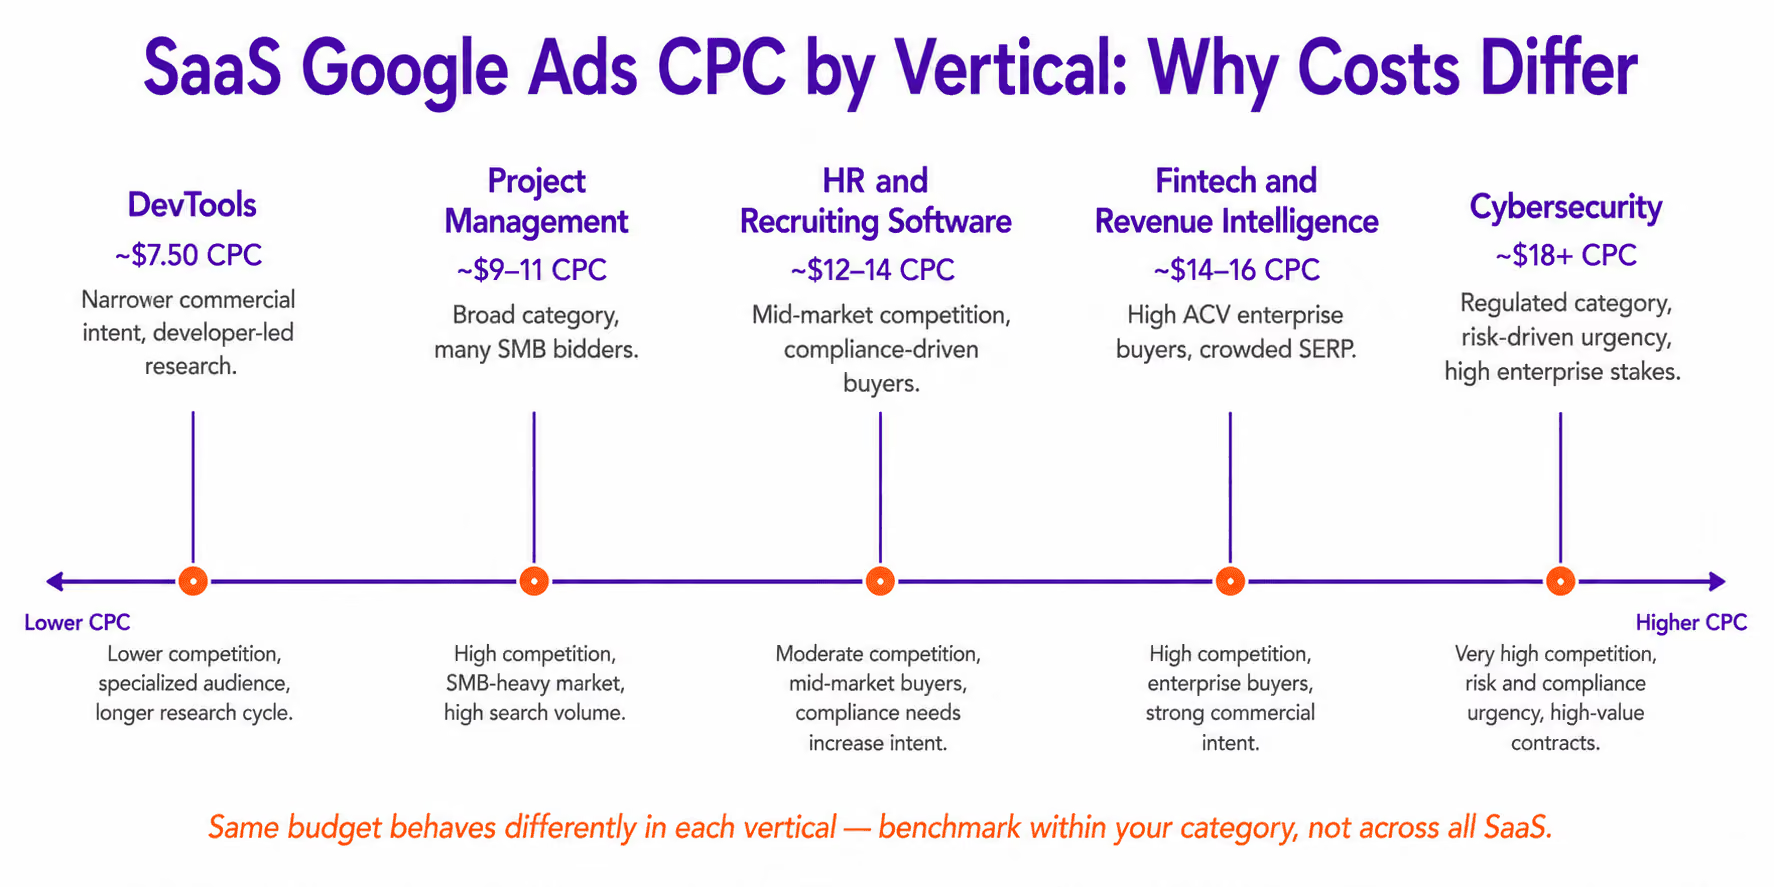
Vertical benchmarks explain where the auction starts, but they do not explain whether the economics work. A higher-cost vertical can still perform well if ACV, SQL quality, opportunity rate, and payback support the spend. A lower-cost vertical can still waste budget if the traffic is cheap but poorly qualified.
In 2026, the biggest vertical-level cost drivers are:
- High-ACV categories with many enterprise bidders
- Crowded comparison SERPs like "best [category] software"
- Competitor terms with high strategic value and lower conversion rates
- Technical categories with narrow but high-intent search volume
- Regulated categories where trust, proof, and compliance influence conversion
Benchmarks by ACV
ACV changes the meaning of “expensive.”
A $1,500 SQL can be unsustainable for a $10K ACV product. The same SQL cost can be excellent for a $100K ACV product if sales efficiency, retention, and payback support the spend.
GrowthSpree’s 2026 SaaS Google Ads benchmark data also segments target cost per SQL, CAC payback, recommended monthly spend, and campaign structure by ACV range. The table below is useful because it connects paid search costs to SaaS unit economics rather than judging CPL or SQL cost in isolation.
This is where many teams underread benchmarks. They ask, “Is our CPL good?” before asking, “What revenue can this lead realistically create?”
For SaaS, the better question is: Are we paying a reasonable amount for a qualified account, with a real buying problem, in a segment where the unit economics work?
That question is more useful than chasing a lower CPL. A low-ACV SaaS product usually needs tighter search intent, faster conversion, and shorter payback. A high-ACV SaaS product can support higher acquisition costs, but only if the campaign is creating qualified pipeline, not just expensive form fills.
What Is Actually Driving SaaS Google Ads Costs in 2026?
SaaS Google Ads is getting more expensive, but not only because Google is more competitive. The cost problem usually comes from several issues at once: higher non-brand competition, blended reporting, weak landing page relevance, poor conversion signals, and broader search intent.
1. Non-Brand CPC Inflation
Involve Digital cites average non-branded B2B SaaS CPC at $5.34, up 29% year over year. GrowthSpree’s 2026 SaaS benchmark puts median non-brand Search CPC higher, at $8.50-$14.00.
The exact number depends on the dataset, but both sources point in the same direction: non-brand SaaS intent is getting harder to buy cheaply.
More SaaS companies are bidding on:
- Category keywords
- Problem-aware searches
- Competitor terms
- "Best software" searches
- Integration and use-case keywords
- AI-related versions of old software categories
When more serious advertisers enter the same auctions, CPC rises. But higher CPC is not always bad. Paying more for better intent can be profitable. Paying more for vague traffic is where the budget breaks.
2. Blended Reporting Hides the Real Problem
Many SaaS accounts report one blended Google Ads CPL. That number is rarely useful.
Brand Search, non-brand Search, competitor campaigns, remarketing, Performance Max, and display do not behave the same way. Brand campaigns usually have low CPC and high CVR because demand already exists. Non-brand campaigns are true acquisition. Competitor campaigns can be expensive but strategically valuable. Remarketing can look efficient while over-crediting users who were already close to converting.
If all of that is blended together, the account may look healthy while non-brand acquisition is actually inefficient.
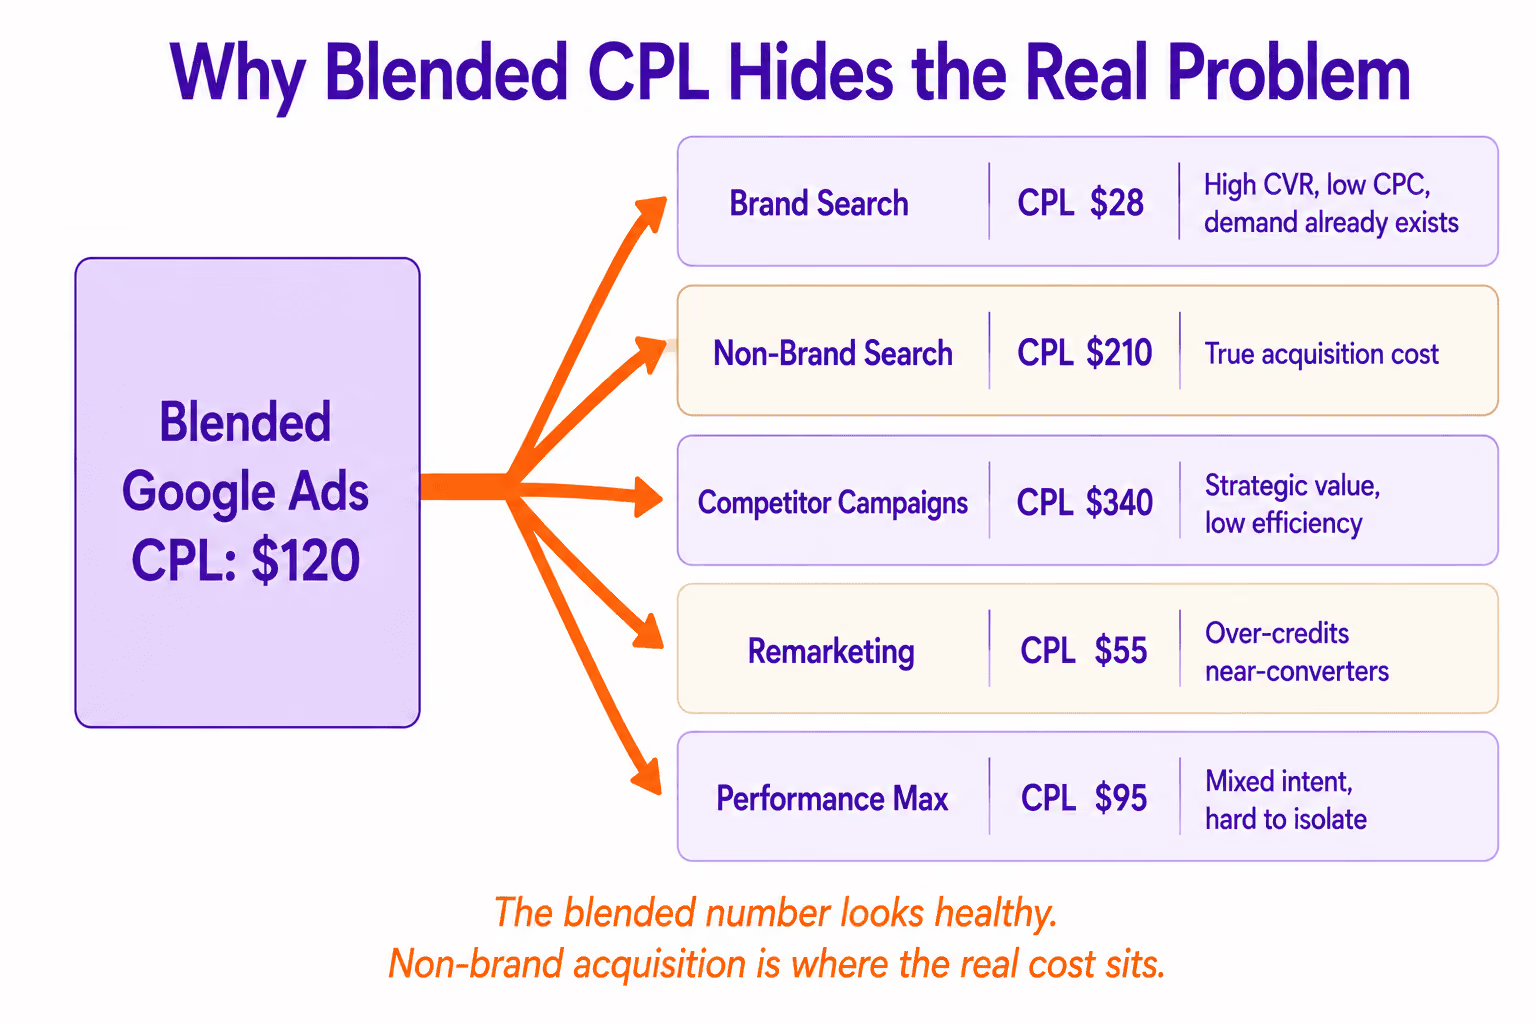
A cleaner SaaS account separates reporting by:
- Brand vs. non-brand
- Search intent
- Vertical or use case
- Company size or ICP segment
- Funnel stage
- Conversion type
- Pipeline quality
This is not reporting neatness. It is how you find waste.
3. Landing Pages Are Too Generic
Google Ads costs do not end at the auction. A high CPC becomes a high CPL when the landing page does not match the query.
The most common SaaS landing page problem is using one demo page for every intent. A CFO searching for "subscription revenue forecasting software" and a RevOps manager searching for "best SaaS revenue analytics tools" should not land on the same generic page.
Better landing pages usually match:
- The category
- The buyer role
- The pain point
- The use case
- The competitor comparison
- The proof needed to move forward
This affects conversion rate, but it can also affect CPC. Google’s Quality Score documentation explains that Quality Score is a diagnostic tool based on expected CTR, ad relevance, and landing page experience. It is not a KPI to optimize in isolation, but it is useful when CPC is unusually high because it helps reveal whether the problem is the keyword, the ad, or the post-click experience.
4. Automation Is Optimizing Toward the Wrong Signals
Performance Max, broad match, and Smart Bidding can work for SaaS. The problem is not automation. The problem is weak conversion data.
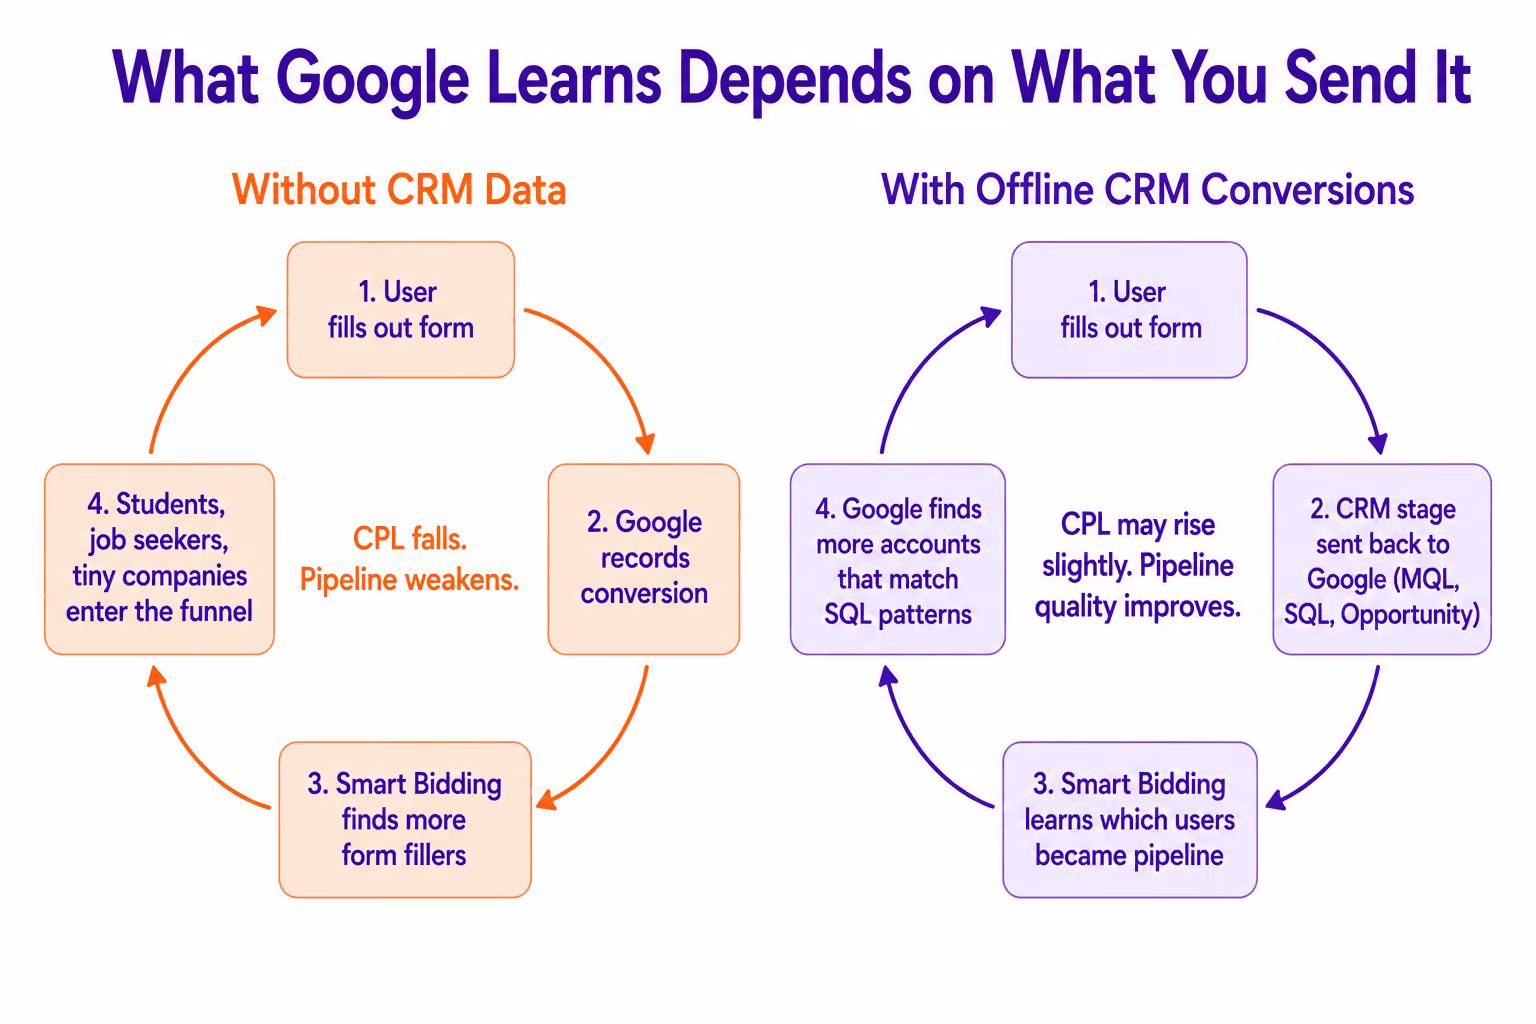
Google’s Smart Bidding documentation explains that automated bidding uses Google AI to optimize for conversions or conversion value in each auction. That is powerful if Google knows which conversions matter.
For SaaS, it often does not.
If Google sees every form fill as equal, it will find more form fills. That may include students, job seekers, tiny companies outside the ICP, consultants, or free users who will never become customers.
The fix is to import offline conversion data from your CRM. Google supports offline conversion imports and enhanced conversions for leads, which allow advertisers to send later funnel events back into Google Ads. For SaaS, those events often include MQL, SQL, opportunity, closed-won, or revenue value.
Involve Digital argues that B2B SaaS accounts using offline conversions and value-based bidding generate 3x more pipeline at 31% lower CPL. Your exact result may differ, but the principle is solid: Google Ads performs better when it can learn from sales quality, not only lead volume.
Aimers saw the same principle in practice with Cloudvisor, a cloud management SaaS. The original Performance Max campaign was generating low-intent and spammy leads because the system was optimizing toward surface-level form submissions. We mapped the full funnel from form submission to MQL, SQL, Opportunity, and Closed-Won, then integrated key HubSpot conversion events into Google Ads so the campaign could optimize toward better downstream signals. As a result, Cloudvisor increased its MQL-to-SQL conversion rate by 130% and grew Opportunity volume by 50%. The lesson is simple: automation becomes more useful when the feedback loop reflects sales quality, not just lead volume.

5. Search Intent Is Getting Broader
AI-driven matching and campaign expansion can help accounts discover demand. It can also push spend into softer queries.
This is especially risky in SaaS because many terms have multiple meanings. A keyword can attract buyers, students, job seekers, consultants, integration researchers, support users, and very small businesses at the same time.
GrowthSpree’s Google Ads waste report shows why this matters. Across 43 enterprise B2B SaaS accounts and $31.2M in annualized spend, the report found a 36.1% average wasted-spend rate, with waste concentrated across search terms, device allocation, time-of-day patterns, geography, and competitor bidding.
That is why search term hygiene still matters in 2026.
Strong accounts regularly exclude:
- Jobs and careers intent
- Login and support intent
- Free-only searches when the model does not support them
- Tutorials and definitions
- Irrelevant industries
- Consumer use cases
- Geographies or company sizes outside the ICP
Automation is useful. It still needs guardrails.
How to Interpret CPC, CPL, and SQL Cost Together
Looking at one metric in isolation can lead to the wrong decision. SaaS Google Ads performance only makes sense when CPC, CPL, SQL rate, opportunity rate, ACV, and payback are read together.
A lower CPC is not always better. A lower CPL is not always more efficient. A higher cost per SQL is not always a problem. The question is whether the campaign is creating qualified pipeline at a cost the business model can support.
The goal is not to make every metric low. The goal is to make the economics work.
For example, lowering CPC by cutting high-intent keywords may improve the dashboard and hurt revenue. Lowering CPL with a softer offer may increase lead volume and reduce SQL rate. Moving budget from non-brand Search into brand Search may improve blended efficiency while reducing new pipeline.
SaaS teams should review Google Ads performance in this order:
- Spend by campaign type
- CPC and CTR by intent
- Landing page conversion rate by offer
- CPL by conversion type
- MQL-to-SQL and SQL-to-opportunity rate
- Cost per opportunity and pipeline value
- CAC payback and revenue impact
That is a much better view than “CPL went up, so cut bids.” A useful benchmark review should explain where the economics break: auction cost, traffic quality, post-click conversion, qualification rate, sales progression, or payback.
Campaign Structure That Makes Benchmarks Useful
Benchmarks only help when your account is structured clearly enough to compare similar campaigns against similar expectations.
A blended account makes every benchmark harder to read. Brand Search, non-brand Search, competitor campaigns, remarketing, Performance Max, and experiments all have different economics. If they are grouped together, the account may look efficient while the main acquisition campaigns are underperforming.
A strong SaaS Google Ads structure usually separates:
- Brand Search
- Non-brand category Search
- Use-case Search
- Competitor Search
- Problem-aware Search
- Remarketing
- Performance Max or AI-assisted expansion
- Experiments
Each campaign type needs its own expectations.
This structure makes benchmarks more useful because each campaign type can be judged by the right metric. Brand Search should not be used to make blended CPL look better. Remarketing should not hide weak non-brand acquisition. Performance Max should not be scaled before the account can distinguish qualified pipeline from soft conversions.
For more tactical cleanup ideas, Aimers has guides on Google Ads optimization, PPC management, and a practical Google Ads optimization checklist.
What Top-Performing SaaS Accounts Do Differently
Top-performing SaaS Google Ads accounts are rarely built on one clever trick. They usually win because the fundamentals are cleaner, the data is more useful, and the account is easier to diagnose.
They:
- Separate brand and non-brand performance
- Build landing pages around specific search intent
- Use negative keywords aggressively
- Import CRM-stage conversions
- Assign different values to different conversion events
- Review search terms and audience signals regularly
- Separate soft conversions from qualified pipeline signals
- Connect reporting to SQLs, opportunities, and revenue
- Test offers without treating all leads as equal
Bottom-performing accounts tend to do the opposite. They blend campaign types, optimize for raw leads, send traffic to generic pages, underuse CRM data, and judge success from the Google Ads interface alone.
That is how a SaaS company can appear to have a good CPL while spending heavily on leads that never become pipeline.
The difference is not just execution quality. It is measurement quality. Strong accounts know which campaigns create real acquisition, which ones only capture existing demand, and which ones generate leads that sales cannot use.
What to Audit First If Your Costs Look Too High
If your Google Ads account looks expensive compared with SaaS benchmarks, do not start by lowering bids. Start by finding where the economics are breaking: auction cost, traffic quality, landing page conversion, lead qualification, or sales progression.
1. Segment the Benchmark
Compare your numbers by vertical, ACV, geography, and campaign type. A single account-wide average will hide the answer.
2. Separate Brand From Acquisition
Brand Search can make the whole account look better than it is. Judge non-brand acquisition separately so you can see what it actually costs to create new demand.
3. Audit Search Terms
Look for irrelevant intent: jobs, free tools, support, login, templates, tutorials, definitions, students, consumer use cases, and wrong industries. Cheap clicks are not useful if they come from people who could never become customers.
4. Review Landing Page Match
The page should clearly reflect the keyword intent. If every campaign goes to the same demo page, conversion rate will usually suffer because the page is asking different buyers with different problems to take the same action.
5. Check Conversion Quality
Compare lead volume with MQL rate, SQL rate, opportunity rate, and close rate. If the drop happens after the form fill, the campaign may be optimizing for the wrong signal.
6. Import Offline Conversions
Send MQL, SQL, opportunity, and closed-won data back into Google Ads. SaaS sales cycles are too long and too complex to optimize only on front-end forms.
7. Review Bidding Strategy
Smart Bidding works best with enough clean conversion volume and meaningful conversion values. If the data is thin or low quality, automation can scale the wrong leads.
8. Reallocate Budget by Intent
Some expensive keywords are worth keeping. Some cheap traffic is worth cutting. Budget should follow qualified pipeline, not just CPC or CPL.
Final Thoughts
The best SaaS Google Ads benchmark is not a single CPC, CPL, or conversion rate. It is a clear view of what your company pays for qualified demand in your category, at your ACV, with your sales cycle and revenue model.
That is why benchmarks should be used as diagnostic tools, not fixed targets. If CPC is rising but SQL quality, opportunity rate, and payback are strong, the account may still be healthy. If CPL is falling but pipeline quality is weak, the account may be moving in the wrong direction.
In 2026, SaaS teams should judge Google Ads by more than front-end efficiency. Intent quality, landing page relevance, CRM-stage conversion data, bidding signals, and revenue impact all matter. Benchmarks can show where to investigate, but the real answer comes from your CRM, your pipeline, and your unit economics.
Aimers helps SaaS and tech companies turn Google Ads into a pipeline-focused acquisition channel. If your account is spending more but producing less qualified demand, the problem may not be the channel itself. It may be the way campaigns, landing pages, tracking, and bidding are connected.
Let’s find where your Google Ads economics can improve fastest.
FAQs
What is a good SaaS Google Ads CPC in 2026?

What is a good SaaS Google Ads CPL?
What is a good cost per SQL for SaaS Google Ads?
Should SaaS companies use Performance Max?
How can SaaS teams reduce Google Ads costs?