Google Ads vs Facebook Ads for SaaS: Costs & Funnel Fit

February 25, 2026
Unfortunately for many SaaS companies, you can't set up performance channels once and never look back. In our experience as a digital marketing agency for SaaS, any strategy needs to be reviewed over time: in terms of cost, lead quality, and actual contribution to the pipeline. The same product can perform differently in different advertising ecosystems.
In this article, we compared Google Ads vs Facebook Ads for SaaS based on three key parameters: cost, lead quality, and funnel stage alignment. This is not a universal guide on how to allocate your advertising budget. But our findings will help you identify where your current PPC strategy is losing effectiveness and what changes can deliver measurable results.
What is Google Ads?
First and foremost, Google Ads is a demand capture tool. The ongoing debate around Facebook vs Google Ads for business often ignores this structural difference in intent. Ads are displayed in response to specific user search queries indicating an intention to solve a particular problem or complete a specific task.
According to the IAB and PwC, the value of digital advertising in the US reached $259 billion in 2024. Of that amount, $102.9 billion was spent on search advertising, making it the largest market segment. These numbers demonstrate that companies are willing to pay more for high-intent traffic.

In SaaS, Google Ads is most often used for:
- Capturing demo requests
- Intercepting competitor queries
- Working with high-intent commercial queries
- Protecting brand traffic
The channel has only one limitation: search demand volume. If there are no regular queries for a product, Google will not create them itself. The channel is only intended for capturing interest. For a more detailed framework, see our Google Ads strategy for SaaS.
What is Facebook Ads?
Facebook Ads (Meta ecosystem) operates on a different model. The service displays ads based on user behavior, interests, and an algorithmic assessment of likely interaction. Users do not enter a query; rather, the ads are displayed in their feeds, capturing their attention. Following Facebook ads best practice becomes critical as auction pressure increases.
At the end of 2024, Meta reported the following:
- A 10% year-on-year increase in the average price per ad
- An 11% year-on-year increase in the number of impressions
These changes reflect a trend toward:
- Increased competition for attention
- Increased cost of reach
- Decreased guaranteed cheap leads
In SaaS, Facebook Ads are more often used for:
- Building category awareness
- Warming up the audience
- Promoting webinars and lead magnets
- Retargeting
Unlike Google, the scale of Facebook Ads is limited not by the number of queries but by the size of the available audience. This structural difference explains much of the difference between FB Ads and Google Ads in scaling behavior. It is also limited by how quickly the effectiveness of creatives declines as the frequency of impressions increases.
Structural Comparison for SaaS
The difference between these platforms becomes clearer when viewed structurally. Choosing between Google Ads or Facebook Ads for SaaS depends on where intent enters the funnel.
Table: Structural Comparison for SaaS
As you can see, the differences in cost are not accidental. Comparing Google advertising vs Facebook advertising without accounting for intent leads to misleading conclusions. They originate from intent structure. Lead quality differences are not random. They emerge from funnel position.
Costs: Benchmarks and what they do and do not mean for SaaS
Google Ads and Facebook Ads differ in both advertising format and auction economics. Different levels of user intent result in different pricing models. On Google, you compete for established demand, whereas on Facebook, you compete for attention and reach. Therefore, it would be a big mistake to compare Google Ads vs. Facebook Ads cost solely on CPL.
To make an accurate assessment, you need to:
- Understand the market context
- Know the CPC and CPL benchmarks
- Take scaling limitations into account
Market Context: Why Auctions Keep Getting Tougher
Before we compare Google Ads and Facebook Ads based on cost per click (CPC) or cost per lead (CPL), let's review the market context. The increase in customer acquisition costs over the last few years isn't specific to any one platform. It's simply how the digital advertising market is evolving.
As we mentioned, the volume of digital advertising in the US reached $259 billion in 2024, showing a year-on-year increase of approximately 15%. Of this total, $102.9 billion was accounted for by search advertising, making it the largest market segment.
This means that search auctions remain the most competitive area of digital advertising, directly impacting Google advertising cost in competitive SaaS niches. Increased investment in search advertising leads to higher auction density. Consequently, more advertisers compete for the same commercial queries.
In SaaS, this manifests as follows:
- An increase in the average cost per click for queries such as “software pricing” or “X alternative”
- An increase in competitors' share of impressions for the same keywords
- A decrease in impression share with an unchanged budget
All of these metrics can be tracked directly in Google Ads through CPC, Auction Insights, and Search Impression Share metrics, which experienced Google ads management experts regularly monitor in competitive SaaS accounts.
At the same time, Meta reported the following in its 2024 report:
- A 10% year-over-year increase in the average price per ad
- An 11% year-over-year increase in the number of impressions
These figures suggest mounting cost pressures within the Meta ecosystem, which any experienced Facebook advertising agency must factor into budget forecasts. The increase in costs is due to auction density and competition for audience attention, which makes a disciplined Meta ads optimization checklist essential for maintaining efficiency.
This increase is a systemic market factor. To make a fair comparison between Google and Facebook, it is important to note that both companies operate in an increasingly competitive environment. This is often overlooked when asking Google Ads vs Facebook Ads which is better.
CPC and Cpl Benchmarks: Cross Industry Reference Points
Now that we have examined the overall state of the market, it makes sense to see how this is reflected in costs. The following benchmarks are cross-industry averages, not B2B SaaS-specific. They provide context, not absolute truth.
- Google Ads Average CPC (2025): $5.26
- Google Ads Average CPL (2025): $70.11
- Facebook Lead Ads:Average CPC: $1.88
Based on this data, we can make several assumptions about Meta ads vs Google ads in cross-industry benchmarks..
First, Google is more expensive per click on average. This reflects its payment model for explicit user intent and competition around commercial keywords.
Second, Facebook is often cheaper per click because its payment model is based on reach and impressions rather than queries with high commercial intent.
However, average CPL is only the entry point into the funnel. It does not take into account:
- The conversion rate to MQL
- The conversion rate to SQL
- Opportunity creation
- Closing the deal
Lead Quality: How to Compare Channels Without Inventing Rules
In SaaS, the correct way to compare channels is not to start with CPL. The question are Google Ads better than Facebook Ads cannot be answered without looking at SQL progression. To evaluate the quality of leads, it is important to consider how frequently a visitor performs a target action after clicking and the conversion rate for each channel. Third-party research data enables us to compare Google Ads (Search Ads) and Facebook Ads (Paid Social Ads) in this sense.
Google Ads More Often Shows Higher Commercial Intent
Recent studies and reviews by marketing agencies indicate that Google Ads targets users with clear intent who are looking for solutions immediately. This is reflected in a higher conversion rate for lead generation tasks.
According to WordStream's 2025 search ad data, the average conversion rate for Google Search is around 7-7.5% across all industries. This reflects search ads' ability to prompt immediate action after a click. Therefore, search campaigns (Google Ads) often lead to leads that are closer to SQL.
Facebook Ads May Show Higher Lead Conversion Rates, but With Lower Intent
According to public data on paid social media, the average conversion rate for Facebook Ads in lead generation campaigns is around 8.8–9.2%. This rate is higher than that of Google Ads in a number of samples.
It is important to note that we are talking specifically about the initial conversion rate, which is the percentage of users who fill out a form or perform a target action after clicking on an ad. This metric reflects the response to the ad and landing page but does not show the percentage of these leads that will convert to sales qualified leads (SQL) or opportunities. In other words:
- Google Ads has more stable, intent-driven leads that are often closer to SQL
- While Facebook Ads may have a higher conversion rate for initial forms, these leads often require further nurturing and quality checks
Practical Comparison of Channels Based on Quality Metrics
We have identified several relevant market benchmarks that allow you to correlate traffic sources by lead quality (conversion rate).
It is important to note that the data in the table is not SaaS-specific. These are cross-industry benchmarks that illustrate the relative performance of channels.
How is this related to SaaS:
- Google Ads often generates leads with clearer commercial intent because users are actively searching for solutions. This is reflected in the high conversion rates of search queries close to the intent stage
- While Facebook Ads may show comparable or even higher conversion rates at the initial stage, such leads often require further refinement to SQL through warming, retargeting, or a nurturing funnel
- Consequently, leads converted from Facebook typically necessitate more marketing touches than those from Google Search. This is important for SaaS because SQL and opportunities are business metrics, not initial forms
Funnel Fit: How Google Ads and Facebook Ads Operate in the SaaS Funnel
In SaaS, it's important to do more than just get traffic or leads; you also need to understand where demand is generated, where it's intercepted, and at what stage it contributes to SQL and opportunities. This is where the recurring question which is better Google or Facebook Ads becomes misleading – because funnel fit depends on where value is created, not on platform preference.
That's why we analyze the actual behavior of Google and Facebook ads in the funnel, including their effect on direct conversions, their role in assisted touches, and the conditions under which they become the primary or secondary source of the pipeline.
How Google Ads Works in the SaaS Funnel
In most SaaS scenarios, Google Ads intercepts active demand. The user initiates the request and signals their intent. In terms of the funnel, this occurs more often at the mid and bottom levels.
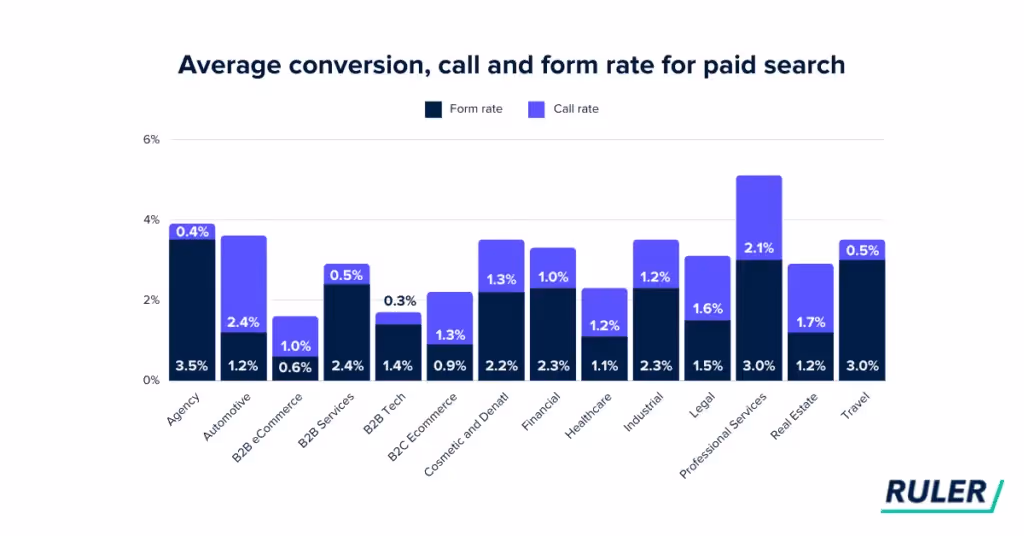
There is direct behavioral confirmation of this at the level of conversions from traffic to applications. Based on 100+ million data points, Ruler Analytics shows that the average paid search conversion rate across all industries is 3.2%. While this data is not limited to SaaS, it can be used as a benchmark for the channel's position in the funnel.
How Facebook Ads Works in the SaaS Funnel
Meta ads are typically more effective at generating demand and warming up audiences because the message is delivered algorithmically without a request. This allows for faster and larger-scale testing, but the quality of applications depends more on the offer, the capture form, and the warm-up.
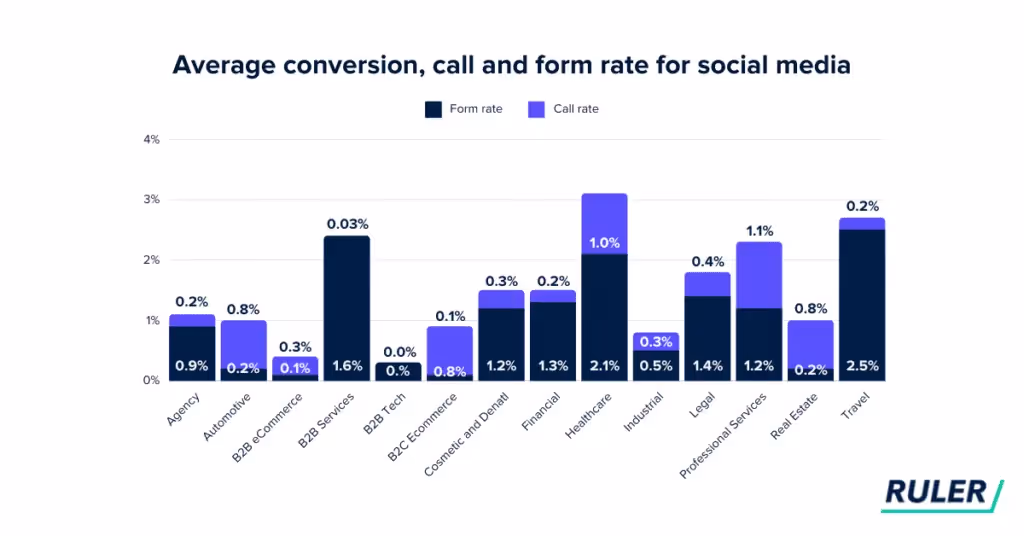
The same Ruler dataset shows an average conversion rate of 1.5% for social media as a source (industry average). This confirms the classic funnel fit pattern. Paid social media generates initial leads more often in the early stages of interaction but less often leads to direct conversions in SQL compared to search.
Alternative Data on Channel Performance
Unbounce publishes conversion benchmarks for landing pages. In their sample, paid social converts at a rate of 12%, while search converts at a rate of 10.9%. This is not a contradiction but rather a difference in methodology, which is often overlooked in surface-level Google Ads vs Facebook Ads which is better comparisons.
Ruler counts conversions by source across multiple sites and uses cross-site analytics based on its definition of conversion. Unbounce, on the other hand, counts conversions on landing pages, and the number depends on the type of page, offer, and form. Many such pages are already mid- or bottom-funnel.
For SaaS, Facebook can provide high landing page conversion rates with a strong offer and well-designed page. However, this does not guarantee SQL or pipeline. However, this is only a hypothesis, not confirmed data.
Funnel Fit Comparison With Published Benchmarks (Cross-Industry)
When the goal is to generate consistent SQL from existing demand, Google Ads typically fits better in the middle or bottom of the funnel because the intent is evident in the query itself. This is confirmed by the fact that, on average, paid search converts higher than social across a large dataset.
However, if the goal is to expand the top of the funnel and quickly test audiences and offers, Facebook Ads often wins in terms of scale and can deliver competitive landing page conversions.
Funnel fit cannot be assessed by a single metric. At a minimum, you need a combination of lead rate and SQL rate. Currently, there is no open data that directly compares Google and Facebook in terms of SQL or opportunity for SaaS.
Decision Framework: How to Choose a Starting Point and Split
We created a universal matrix for allocating budgets to advertising channels in SaaS companies. This addresses the recurring strategic dilemma: Facebook or Google Ads as a starting point for pipeline growth. In compiling it, we based our approach on the following:
- Is there a volume of commercial search queries by category, competitors, and alternatives?
- Does the sale require the involvement of the sales department, or can the user pay independently?
- How many steps does a customer typically go through before creating an opportunity?
How to Choose Between Google Ads and Facebook Ads in SaaS
If there is a stable volume of commercial queries for a category or competitors, Google Ads should be the starting point. This allows you to work with users who are already in the selection phase.
If search demand is limited, the priority shifts to Facebook Ads to form the top of the funnel and build an audience for subsequent capture through Search.
In complex B2B models with long deal cycles, distribution is rarely single-channel. Social supports warming and awareness within the buying committee, while retargeting on Facebook ads reinforces repeated exposure before active search begins. Search captures active intent.
Even legacy discussions such as Google adwords or Facebook ads should ultimately be reframed around pipeline impact. The final decision should be evaluated through SQL, opportunity, and blended CAC, rather than CPL. These metrics show whether the channel is making a sustainable contribution to the pipeline.
FAQs
Which is better for SaaS: Google Ads or Facebook Ads?
Why Facebook provides cheap leads but a weak pipeline?
Why you can't compare channels based on CPL alone in SaaS?
Is it possible to scale SaaS only through Google?
How can you tell that you need to change the budget allocation between Google and Facebook?
February 24, 2025
.avif)