
Lead Growth Through Google PPC for TuxCare, a Cybersecurity SaaS

They work VERY hard in optimizing our campaigns, and they have gone above and beyond tracking micro-conversions, which leads to better quality traffic. Any change we've wanted in our campaign has been completed in a matter of days - not weeks. The results have been amazing. We have 4x our monthly traffic, we have improved the quality of traffic, and, most importantly, we are now receiving quality leads and continue to do so. Our traffic is hyper-targeted to our audiences, and I feel we will improve as time goes on.

TuxCare is a division of CloudLinux focusing on making open source Linux enterprise grade by automating, simplifying, and enhancing enterprise Linux operations.
TuxCare offers automated security patching and support solutions for over 40 Linux distributions. TuxCare solutions:
- Live Patching Services (KernelCare Enterprise),
- Extended Lifecycle Support,
- Enterprise AlmaLinux Support.
increase in the leads number
decrease in the CPA
Challenge
Since TuxCare is a SaaS product for Enterprise customers, the sales cycle length is rather big: about 60–90 days. It makes it difficult to get quick feedback on the quality of leads, which is needed for analysis and optimizations.
Initially, there were active campaigns that ran for about a year, but with almost no conversions. We started to promote 1 solution (Live Patching Services (KernelCare Enterprise)), but ended up promoting several TuxCare solutions for the B2B market.
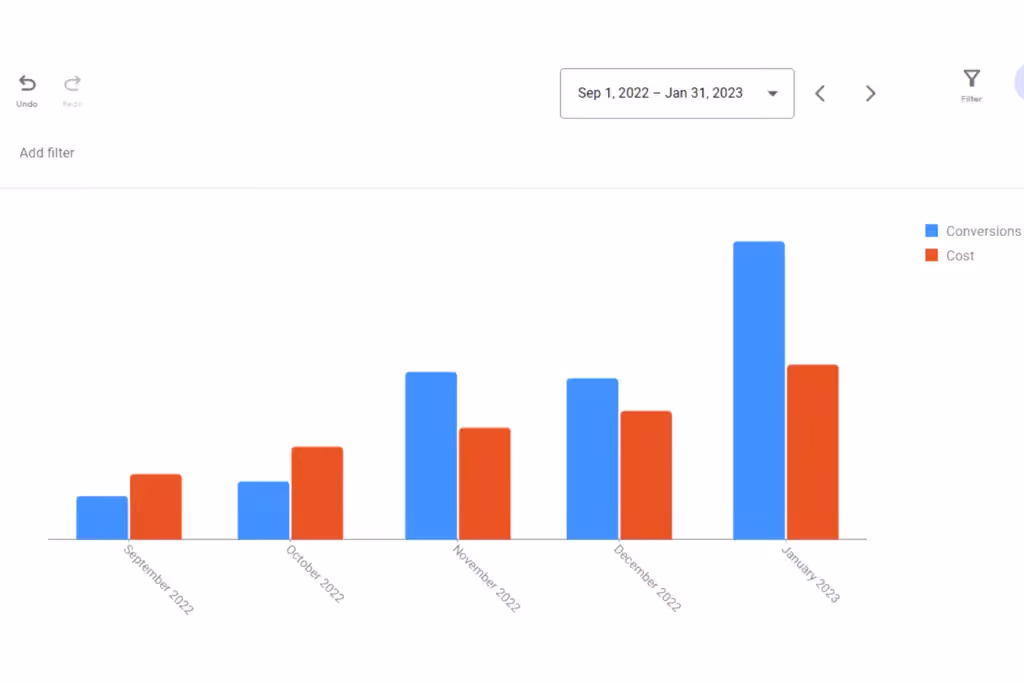
Below are the screenshots of the dynamics in August before working with us and after our campaigns were launched in September. The CPA was much higher then, and the volume of conversions gradually increased from month to month, peaking in January.
The increasing number of conversions from our campaigns allowed us to spend more budget on testing different approaches. Meanwhile, the Cost per Conversion was decreasing.


Solution
We started our work with readjusting the conversion tracking to ensure it is implemented correctly.
Most of the campaigns that are running now were created from scratch, some previous ones have been refined and restructured.
The types of campaigns we worked with: Google Ads - Search and Display.
What we did within Search campaigns:
- Testing of the automated bidding strategies;
- Attracting more relevant traffic, increasing Search impression;
- Launching the campaigns with new solutions;
- Using Audience segmentations for observation for analysis purposes;
- Testing the use of Landing pages in the local language of the target region;
- Optimization of bid adjustments by the following parameters: devices, locations, audience, age, gender, keywords;
- Adding the irrelevant search queries to the list of negative keywords.
What we did within Display campaigns:
- Testing of the automated bidding strategies;
- Using the various targeting settings: Topics, Custom intent audiences, Remarketing audiences, Affinity audiences, In-market audiences, Audience of users distinguished by OS;
- Testing the banners to find the most clickable USP;
- Conducting the relevance analysis of placements, elimination of irrelevant ones;
- Optimization of bid adjustments by the following parameters: devices, locations, audience, age, gender.
Results
Total results for Search and Display campaigns in January compared to September:
- Conversions increased by 6 times,
- CPA decreased by 61%,
- CR increased by 6%.
Search Campaign Results in January compared to September:
- Conversions increased by 4 times,
- CPA decreased by 61%,
- CR increased by 6%.


Explore More Success Stories


Check out Our Additional Services
Paid Search
Our targeted campaigns on Google Ads and Microsoft Ads ensure that your brand stands out at the right moment.
Paid Social
We run powerful campaigns on Facebook, Instagram, LinkedIn, and X to build your brand’s presence.
Conversion Rate Optimization
We optimize your site to maximize conversions, ensuring every visitor has the best chance to become a paying customer.
Landing Page Design
Our landing pages are designed to convert traffic into leads with engaging content and clear calls to action.